Supplementary Material : Linking Cellular and Mechanical Processes - - PDF document

supplementary material linking cellular and mechanical
SMART_READER_LITE
LIVE PREVIEW

Supplementary Material : Linking Cellular and Mechanical Processes - - PDF document

Supplementary Material : Linking Cellular and Mechanical Processes in Articular Cartilage Lesion Formation: A Mathematical Model Georgi I. Kapitanov*, Xiayi Wang, Bruce P. Ayati, Marc J. Brouillette, James A. Martin *Correspondence: Author


slide-1
SLIDE 1

Supplementary Material: Linking Cellular and Mechanical Processes in Articular Cartilage Lesion Formation: A Mathematical Model

Georgi I. Kapitanov*, Xiayi Wang, Bruce P. Ayati, Marc J. Brouillette, James

  • A. Martin

*Correspondence: Author Name: Georgi I. Kapitanov georgi-kapitanov@uiowa.edu

1 SUPPLEMENTARY TABLES AND FIGURES

1.1 Figures

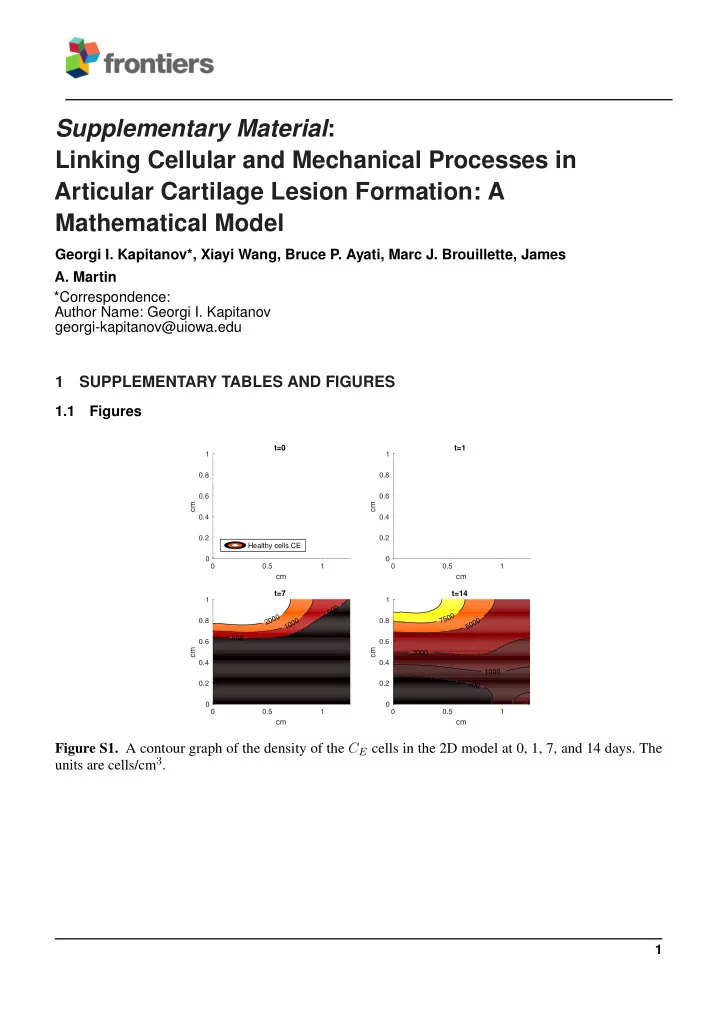
cm 0.5 1 cm 0.2 0.4 0.6 0.8 1 t=0 Healthy cells CE cm 0.5 1 cm 0.2 0.4 0.6 0.8 1 t=1 cm 0.5 1 cm 0.2 0.4 0.6 0.8 1 500 500 1000 2000 t=7 cm 0.5 1 cm 0.2 0.4 0.6 0.8 1 5 1000 2000 5000 7500 t=14

Figure S1. A contour graph of the density of the CE cells in the 2D model at 0, 1, 7, and 14 days. The units are cells/cm3.

1

slide-2
SLIDE 2

Kapitanov Supplementary Material

cm 0.5 1 cm 0.2 0.4 0.6 0.8 1 t=0 Catabolic cells SA cm 0.5 1 cm 0.2 0.4 0.6 0.8 1 t=1 cm 0.5 1 cm 0.2 0.4 0.6 0.8 1 50 100 t=7 cm 0.5 1 cm 0.2 0.4 0.6 0.8 1 5 100 200 1000 t=14

Figure S2. A contour graph of the density of the SA cells in the 2D model at 0, 1, 7, and 14 days. The units are cells/cm3.

cm 0.5 1 cm 0.2 0.4 0.6 0.8 1 t=0 DAMPs cm 0.5 1 cm 0.2 0.4 0.6 0.8 1 0.0001 0.0002 t=1 cm 0.5 1 cm 0.2 0.4 0.6 0.8 1 0.0001 0.0002 t=7 cm 0.5 1 cm 0.2 0.4 0.6 0.8 1 0.0002 0.0005 t=14

Figure S3. A contour graph of the concentration of DAMPs in the 2D model at 0, 1, 7, and 14 days. The units are nanomolar.

2

slide-3
SLIDE 3

Kapitanov Supplementary Material

cm 0.5 1 cells/cm 3 ×10 4 2 4 6 8 10 t=0 Healthy cells CU cm 0.5 1 cells/cm 3 ×10 4 2 4 6 8 10 t=1 cm 0.5 1 cells/cm 3 ×10 4 2 4 6 8 10 t=7 cm 0.5 1 cells/cm 3 ×10 4 2 4 6 8 10 t=14

Figure S4. Average density of CU cells along the radius of the model cylinder at 0, 1, 7, and 14 days. The CU cells are less dense near the area of contact.

cm 0.5 1 cells/cm 3 2000 4000 6000 8000 t=0 Pre-catabolic cells CT Healthy cells CE cm 0.5 1 cells/cm 3 2000 4000 6000 8000 t=1 cm 0.5 1 cells/cm 3 2000 4000 6000 8000 t=7 cm 0.5 1 cells/cm 3 2000 4000 6000 8000 t=14

Figure S5. Average density of CT and CE cells along the radius of the model cylinder at 0, 1, 7, and 14

  • days. The density of CE cells is higher near the contact area, while the density of the CT cells is more

evenly distributed.

Frontiers 3

slide-4
SLIDE 4

Kapitanov Supplementary Material

cm 0.5 1 cells/cm 3 500 1000 1500 2000 t=0 Catabolic cells ST Catabolic cells SA cm 0.5 1 cells/cm 3 500 1000 1500 2000 t=1 cm 0.5 1 cells/cm 3 500 1000 1500 2000 t=7 cm 0.5 1 cells/cm 3 500 1000 1500 2000 t=14

Figure S6. Average density of ST and SA cells along the radius of the model cylinder at 0, 1, 7, and 14

  • days. The densities of both cell states are higher near the contact area.

cm 0.5 1 nanomolar ×10 -3 0.5 1 1.5 t=0 PIC DAMPs EPO cm 0.5 1 nanomolar ×10 -3 0.5 1 1.5 t=1 cm 0.5 1 nanomolar ×10 -3 0.5 1 1.5 t=7 cm 0.5 1 nanomolar ×10 -3 0.5 1 1.5 t=14

Figure S7. Average concentrations of EPO, DAMPs, and PIC along the radius of the model cylinder at 0, 1, 7, and 14 days. DAMPs and particularly EPO concentrations are higher near the contact area. PIC concentrations are more evenly spread, although their concentrations are also somewhat higher near the area of contact.

4

slide-5
SLIDE 5

Kapitanov Supplementary Material

cm 0.5 1 nanomolar 0.02 0.04 0.06 0.08 0.1 t=0 ROS cm 0.5 1 nanomolar 0.02 0.04 0.06 0.08 0.1 t=1 cm 0.5 1 nanomolar 0.02 0.04 0.06 0.08 0.1 t=7 cm 0.5 1 nanomolar 0.02 0.04 0.06 0.08 0.1 t=14

Figure S8. Average concentrations of ROS along the radius of the model cylinder at 0, 1, 7, and 14 days. The concentrations are higher near the area of contact.

cm 0.5 1 mg/cm 3 29.9 29.95 30 30.05 t=0 ECM cm 0.5 1 mg/cm 3 29.9 29.95 30 30.05 t=1 cm 0.5 1 mg/cm 3 29.9 29.95 30 30.05 t=7 cm 0.5 1 mg/cm 3 29.9 29.95 30 30.05 t=14

Figure S9. Average ECM density along the radius of the model cylinder at 0, 1, 7, and 14 days. The pressure applied is not enough to produce high deterioration of the ECM.

Frontiers 5