
SLIDE 1
Ha r ve y S. E a stman, PhD Albuque r que , NM T imothy Mur in, NE T L
- AE
COM, Pittsbur gh, PA
Top left and bottom right are from Frohlich, 2013, Texas Induced Seismicity Webinar
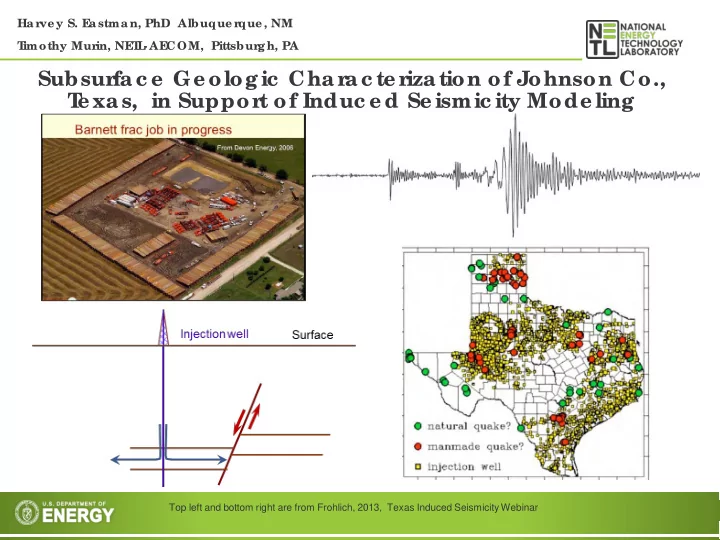
Subsur fac e Ge ologic Char ac te r ization of Johnson Co., T - - PowerPoint PPT Presentation
Ha r ve y S. E a stman, PhD Albuque r que , NM T imothy Mur in, NE T L -AE COM, Pittsbur gh, PA Subsur fac e Ge ologic Char ac te r ization of Johnson Co., T e xas, in Suppor t of Induc e d Se ismic ity Mode ling Top left and
Ha r ve y S. E a stman, PhD Albuque r que , NM T imothy Mur in, NE T L
COM, Pittsbur gh, PA
Top left and bottom right are from Frohlich, 2013, Texas Induced Seismicity Webinar
2
3
4
5
Dallas, TX
6
Re d c ir c le s r e pr e se nt e a r thquake e pic e nte r s, 2009 to 2010
7
8
9
10
11
Unit names based on geologic descriptions in Turner, 1957. The Marble Falls is, in part, Pennsylvanian.
12
13
14
15
16
17
18
19
Mapped faults from Mid-continent faults database and Oklahoma faults database (Oklahoma Geologic Survey).
This geologic study in support of induced seismicity was well underway at the time Dr. Eastman leftAECOM in September 2016.
20
This project was funded by the Department of Energy, National Energy Technology Laboratory, an agency of the United States Government, through a support contract with AECOM. Neither the United States Government nor any agency thereof, nor any of their employees, nor AECOM, nor any of their employees, makes any warranty, expressed or implied, or assumes any legal liability or responsibility for the accuracy, completeness, or usefulness of any information, apparatus, product, or process disclosed, or represents that its use would not infringe privately
not necessarily constitute or imply its endorsement, recommendation, or favoring by the United States Government or any agency thereof. The views and opinions of authors expressed herein do not necessarily state or reflect those of the United States Government or any agency thereof.