
SLIDE 1
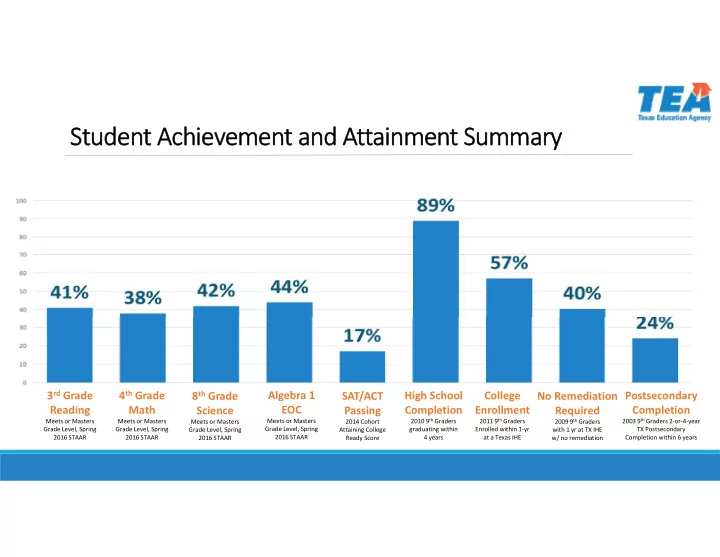
Student Achievement and Attainment Summary
Postsecondary Completion
2003 9th Graders 2‐or‐4‐year
3rd 4th 8th Grade Grade Grade Algebra 1 SAT/ACT High School College No Remediation Reading Math Science EOC Passing Completion Enrollment Required
Meets
- r Masters
Meets
- r Masters
Meets
- r Masters
2010 9th Graders 2011 9th Graders Meets or Masters 2014 Cohort 2009 9th Graders Grade Level, Spring Grade Level, Spring Grade Level, Spring Grade Level, Spring Attaining College graduating within Enrolled within 1‐yr with 1 yr at TX IHE TX Postsecondary 2016 STAAR 2016 STAAR 2016 STAAR 2016 STAAR Ready Score 4 years at a Texas IHE w/ no remediation Completion within 6 years
3