
SLIDE 1
1
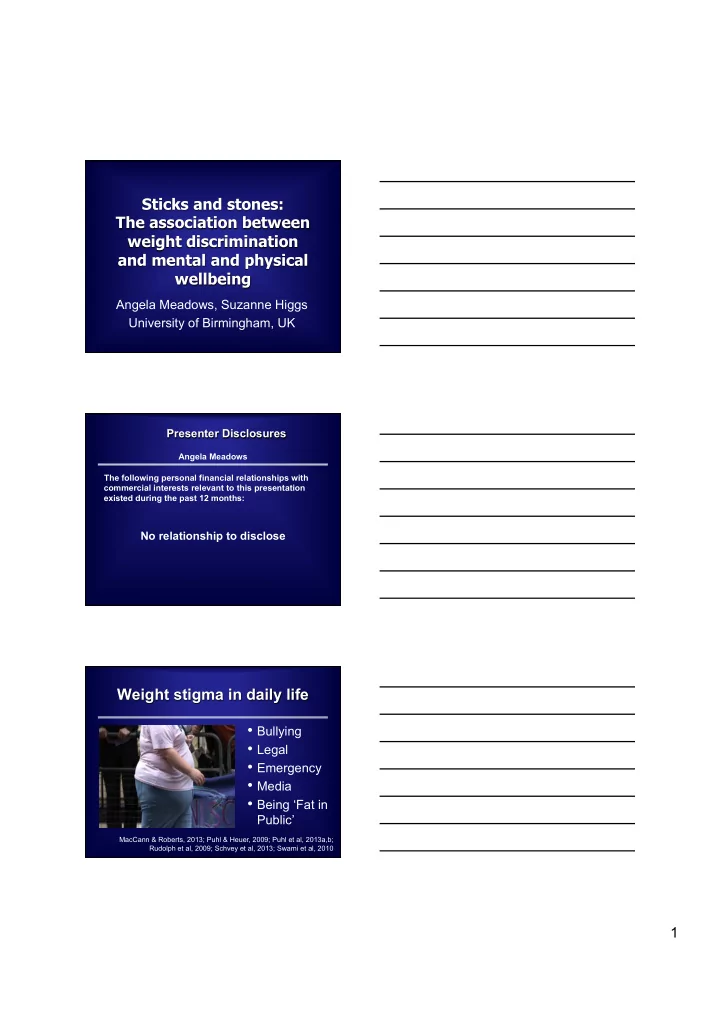
Sticks and stones: The association between weight discrimination and mental and physical wellbeing
Angela Meadows, Suzanne Higgs University of Birmingham, UK Presenter Disclosures
The following personal financial relationships with commercial interests relevant to this presentation existed during the past 12 months: Angela Meadows
No relationship to disclose
Weight stigma in daily life
- Health care
- Education
- Relationships
- Employment
- Customer
service
- Bullying
- Legal
- Emergency
- Media
- Being ‘Fat in
Public’
MacCann & Roberts, 2013; Puhl & Heuer, 2009; Puhl et al, 2013a,b; Rudolph et al, 2009; Schvey et al, 2013; Swami et al, 2010