
SLIDE 1
Stratospheric Ozone at South Pole Begins to Show Signs of Improvement - - PowerPoint PPT Presentation
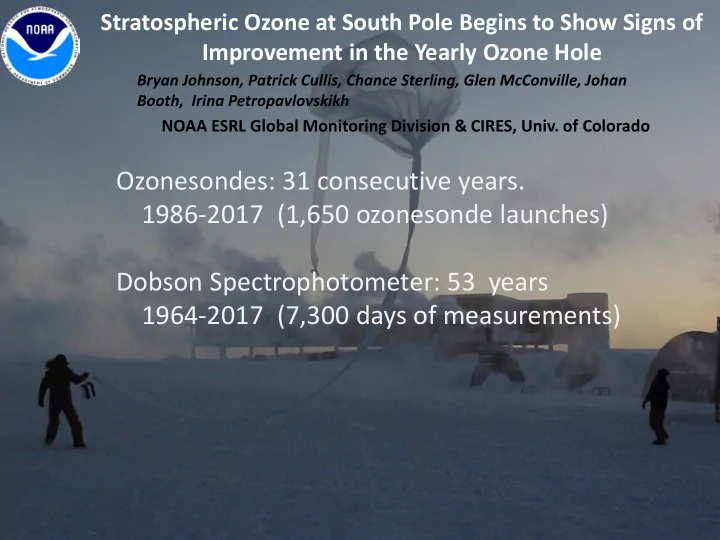
Stratospheric Ozone at South Pole Begins to Show Signs of Improvement in the Yearly Ozone Hole Bryan Johnson, Patrick Cullis, Chance Sterling, Glen McConville, Johan Booth, Irina Petropavlovskikh NOAA ESRL Global Monitoring Division & CIRES,
Photo by Christian Krueger, IceCube
illustration by Patrick Cullis
illustration by Patrick Cullis
Photo by Christian Krueger, IceCube
Total Ozone Column Change (%)
Photo by Christian Krueger, IceCube
Total Ozone Column Change (%)
Antarctica ozone layer recovery publications: 2011: Hassler, et al. An assessment
South Pole: 25 years of ozonesonde measurements (JGR). 2016: Solomon, et al. Emergence of healing in the Antarctic ozone layer (Nature).
14 -21
km
14 -21
km
14 -21
km
Ozonesonde Median: 1990-2014
September Depletion Rate (14-21 km)
Electrochemical Concentration Cell ozonesonde