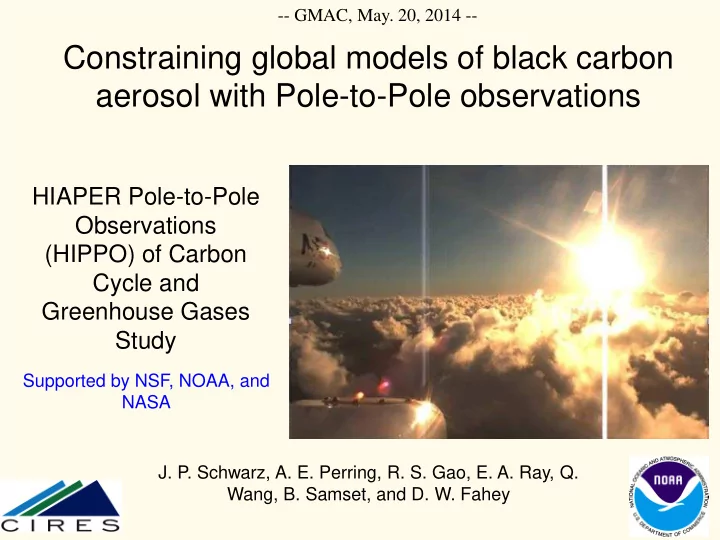

-- GMAC, May. 20, 2014 -- Constraining global models of black carbon aerosol with Pole-to-Pole observations HIAPER Pole-to-Pole Observations (HIPPO) of Carbon Cycle and Greenhouse Gases Study Supported by NSF, NOAA, and NASA J. P. Schwarz, A. E. Perring, R. S. Gao, E. A. Ray, Q. Wang, B. Samset, and D. W. Fahey
Motivation: Climate IPCC AR5 BC DRF - ~0.4 W/m 2 ± 0.4 (Bond et al., 2013: ~0.7 W/m^2 ± 0.6 BC DRF + non direct: 1.1 ± 0.9) Measure – Model – Compare – Improve – See where we are. 2
Outline AeroCom Model BC DRF HIPPO Campaign BC Comparison Implications IPCC AR5, 2013 1/3 of the 12 Global models CAM3 SPRINTARS BC DRF CAM4 OsloCTM2 CAM5 MPI-HAM is in play GISS INCA GMI IMPACT GOCART HADGEM2 3
HIPPO Overview - Unbiased sampling strategy - Seasonal coverage - Global scale - Remote airmasses - Five flight series: Jan. ‘09 Nov. ‘09 M/Apr. 10 June ‘11 Aug. ‘11 - Vertical coverage 4
BC Results: Climatology over the remote Pacific N60-90 S65-60 S60-20 N20-60 S20-N20 5
Northern Polar • High seasonal variability in measurements up to the tropopause • Dramatic collapse of variability into the LS • Similar behavior in the SH • Boundary condition -powerful model constraint Models CAM3 SPRINTARS CAM4 OsloCTM2 CAM5 MPI-HAM GISS INCA GMI IMPACT GOCART HADGEM2 6
Equatorial • Annual minimum in rBC MMR consistent with convective outflow region • Very low variability in rBC MMR above minimum • Model ensemble mean doesn’t reflect this feature 7
Model/Measurement • Approximate annual averages • Best performance in lower trop in NH • Consistent ensemble bias at the the highest altitudes • Poorest performance at mid/upper FT in equatorial region -Very exciting region to focus on! Drives lower stratospheric biases…? Schwarz et al., GRL 2013 8
Improving/Assessing Models • GEOS-CHEM with strengthened BC removal in convection and cold clouds - improved model skill for HIPPO data set. - shortened BC lifetime, - lowered BC DRF Samset et al., in prep 2014 AeroCom models tested against HIPPO show skill inversely proportional to BC lifetime Wang et al., JGR 2014 9
AeroCom: Potential impacts on estimates of BC DRF Theorize similar model bias in all remote regions : Remote: 29% of the globe… 16% of the forcing… Constrained to HIPPO -> 12% reduction in DRF Theorize that upper trop/lower strat model bias is global in extent: 24% of BC RF occurs from mass above 200 hPa … Scaling remote and high altitude lead to 33% reduction in AeroCom BC DRF estimate 10
Conclusions 1) HIPPO observations provide unique insight into remote BC distributions 2) Systematic AeroCom model bias in the HIPPO regions quantified and found to be strongly altitude dependent 3) Remote/high altitude contributions to BC `radiative forcing essential to it’s global impact.
– Thanks to the pilots and crew of the NSF/NCAR GV Comments/questions? Thank You!
SEASONALITY CAUGHT BY MODELS – Southern Midlatitudes The climatological Bottom 4 km Middle 4 km models succeed in capturing some of the seasonality in BC loadings, likely due to seasonal emissions inventories and large scale transport Top 4 km Column Load ng/m 2 Measurement: Heavy orange line AeroCom Mean: heavy black AeroCom models – Light dashed lines 9
HIPPO Overview: Vertical Coverage Altitude, km Latitude 5
• PIs: Harvard, NCAR, Scripps, NOAA • Global and seasonal survey of CO 2 , O 2 , CH 4 , CO, N 2 O, H 2 , SF 6 , COS, CFCs, HCFCs, O 3 , H 2 O, CO 2 isotopes, Ar, black carbon, halocarbons and hydrocarbons (over 90 species). • NSF / NCAR Gulfstream V • Five 3-week campaigns over 3 years, across Pacific between 87 N and 67 S • Continuous profiling between surface and 8-14 km • 64 flights, 434 flight hours, 787 profiles • hippo.ucar.edu, www.eol.ucar.edu/hippo, hippo.ornl.gov Canterbury, New Zealand Pago Pago, American Samoa Brooks Range, Alaska 1
Analysis approach 12 • Each vertical ascent/descent HIPPO 1 60N – 80N treated as an independent profile measurement: Altitude, km statistics based on inter-profile variability. • Whiskers represent standard deviation at each altitude/pressure bin • ~1km resolution 9
Quick Refresher - Experimental Approach Single Particle Soot Photometer (SP2) Courtesy R. Kumar, DRI 1)BC-containging particle enters edge of powerful laser: we optically size it. 2)Non-refractory materials are vaporized: we note evidence of such removal 3)The BC component heats to ~4000K, emits visible light proportional to its mass: we record it, and optically size the core. Shell-and-core simplification BASIC MEAUREMENTS: BC MASS - Assume index of coating TOTAL PARTICLE OPTICAL SIZE - Pretend geometry BC OPTICAL SIZE
• Monthly mean ice production rates by (a) Bergeron and (b) riming processes, averaged between 160°E and 140°W in January 2009. • Largest differences in the tropics and polar regions Fan et al., submitted JGR 2012
Curtains Hippo 2: November 2009 Curtain plots courtesy of Britt Stephens, NCAR
Recommend
More recommend