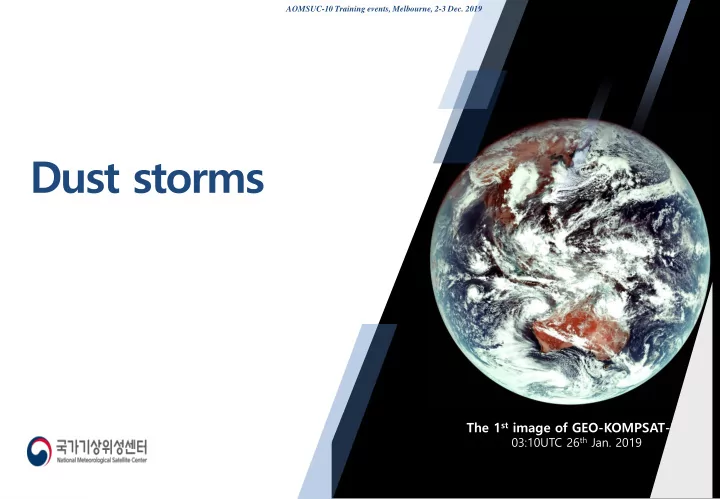

AOMSUC-10 Training events, Melbourne, 2-3 Dec. 2019 The 1 st image of GEO-KOMPSAT-2A 03:10UTC 26 th Jan. 2019
C) COMS Aerosol Optical Depth(AOD) A) COMS Aerosol index(AI) B) Himawari-8 Aerosol Detection(D*) D) Dust RGB(GK2A) E) T rue Color RGB(GK2A) C) T rue Color RGB(GOCI/COMS) 21
GK2A DUST RGB with wind at 1000hPa(07UTC, 27 th Oct. 2019) 500hPa pressure field(18UTC, 26 th Oct. 2019) Mongolia Upper trough Gobi desert Inner Mongolia Strong wind > 25kts Dust observation network between CMA and KMA Aerosol density(PM10) Inner Mongolia Gobi desert PM10 : 500~800ug/m 3 Taklamakan desert Loess plateau 22
15:00UTC 27 th Oct. 2019 21:00 UTC 27 th Oct. 2019 15UTC 18UTC 09UTC 12UTC 15UTC 21UTC (15:00UTC) After the outbreak of dust storm at the Gobi deserts, PM10 densities over the north China increased rapidly by 800ug/m 3 and moving ESE direction with 110km/hr. (21:00UTC) PM10 density over the inner Mongolia are also steadily increasing and moving speed slowed down as 50km/hr, moving direction changed to SE from ESE - 23
Socrative Question 4 . Which product do you prefer for monitoring dust areas ? B) Dust RGB A) DUST RGB (JMA recipe) (KMA recipe) Socrative Question 5 : What’ s the advantage of dust RGB compared to dust products ? (choose all ) C) COMS D) Dust Aerosol Index Detection(D*) 24
Socrative Question 5 : What’s the advantage of dust RGB compared to dust products ? (choose all ) A) They distinguish dust areas very clearly from the clouds area B) They provide quantitative density information better than dust products C) They track the dust area and movement continuously even over the ocean D) The colors of surface shows diurnal variation E) They provide the information of different clouds F) They detect weak dust area better than dust products(AI, D*)
2019. 10. 28. 17:40UTC Baengyeongdo Seoul Gusan Baengyeongdo Particle size : 2~4 µm Dust height < 4km Seoul Gunsan
Socrative Question 6 : Looking at the animation, Where is most likely to be affected by dust on the ground at 06:00UTC 15 April 2018(right image) ? A. Gwangwon-do B. Capital area C. Chungcheong-do D. Gyeongsang-do A B C D 27
Dust RGB and products by satellite detect the floating dusts around 3~4km well Surface instrument observe the dusts or aerosols density near the surface. PM10 density on the ground A B A C B C D D A. Gwangwon-do B. Capital area C. Chungcheong-do D. Gyeongsang-do 270µg/m 3 200µg/m 3 150µg/m 3 120µg/m 3 Time series of 1hr average PM10 density over the Korean Peninsula(15 th April 2018) 28
What make different distribution of dust areas between satellite and surface observation Mainly depend on the vertical motion and density of floating dusts Satellite detect floating dusts at the rising motion area, while surface instrument observes dusts concentrated on the ground Therefore, forecasters should consider vertical motion by referring to the satellite detection when forecasting dust affected areas on the grounds. PV analysis at isentropic field(290K) PM10 density 700 sinking 760 A B C 800 D sinking sinking 840 Sinking area 29
Discussed useful GK2A spectral band and products for monitoring, detection, analysis of convection clouds - Introduced various RGB and spectral images to monitor convective clouds - How to analyse the microphysical properties of convective clouds using RGB and products of GK2A Examined the Dust RGBs to forecast dust affected areas - Detection of dust areas using dust RGBs and products from GK2A - Comparing different observation data : satellite & surface instrument - Introduce how to forecast dust affected areas on the ground 30
31 / 85 국가기상위성센터
Recommend
More recommend