
SST Fall 2016 11/14/16 www.uiowa.edu/seru 1
SERU seeks to broaden our understanding of undergraduate experiences on campuses like ours, and to promote a culture of institutional self-improvement. The SERU Consortium currently includes 15 research universities in addition to UI, plus the University of California system.
University of Alabama University of Florida University of Kansas University of Michigan University of Minnesota University of Southern California Texas A&M University University of Texas at Austin University of Virginia University of Washington University of North Carolina University of Oregon University of Pittsburgh Purdue University Rutgers University https://uiowa.edu/seru/
The University of Iowa has
- ver 21,000 undergraduates,
in more than 100 different fields of study, and we want to know what each of you thinks. Tell us by taking a survey that lets us hear from all of you -- about your classes, your major, life as a student, and your
- verall experience at UI.
When we hear from you, everybody benefits.
All students respond to the Core Survey and one of two randomly assigned modules Core Survey
- Academic engagement
- Time use
- Plans and aspirations
- Evaluation of their major
- Climate for diversity
- Financial concerns
- Overall satisfaction
Student Life and Development:
- personal goals
- campus concerns,
- respect for diverse
viewpoints & identities Institution-Specific Questions:
- high impact practices
- perspective-taking
- student employment
- bstacles to success
- 1. Overall satisfaction and engagement
- 2. Reported time use
- 3. Perceived climate for diversity
- 4. Perceived obstacles to success
- Succeeding in spite of the obstacles
Questions for Reflection:
- What additional perspectives do these survey responses add to the
understanding of student experiences that we share in our office?
- What additional questions are raised by the data?
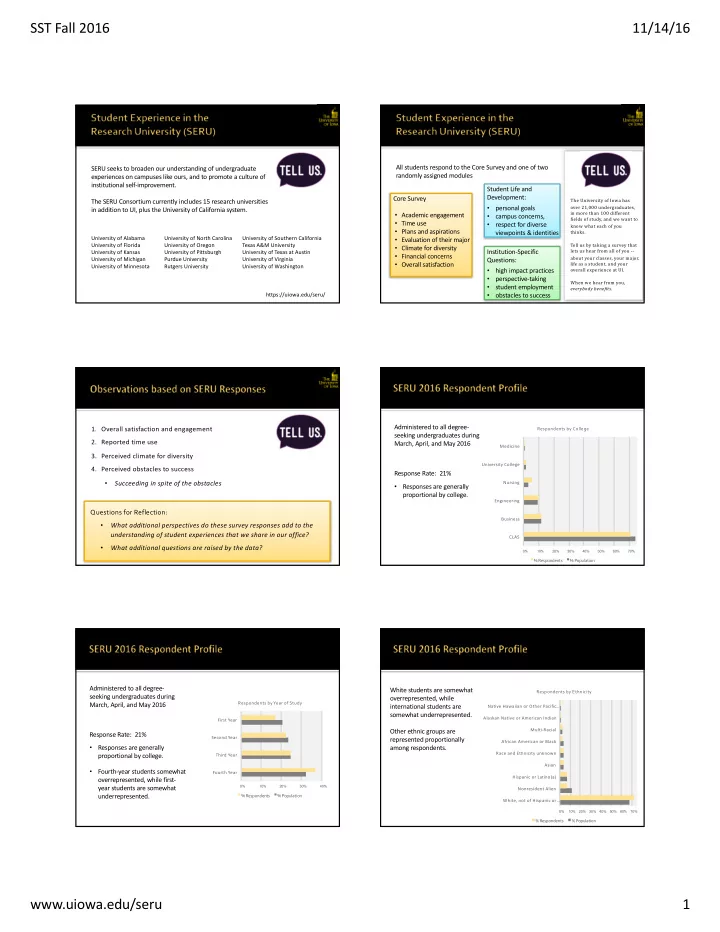
0% 10% 20% 30% 40% 50% 60% 70%
CLAS Business Engineering Nursing University College Medicine Respondents by College % Respondents % Population
Response Rate: 21% Administered to all degree- seeking undergraduates during March, April, and May 2016
- Responses are generally
proportional by college. Response Rate: 21% Administered to all degree- seeking undergraduates during March, April, and May 2016
- Responses are generally
proportional by college.
0% 10% 20% 30% 40%
Fourth Year Third Year Second Year First Year Respondents by Year of Study % Respondents % Population
- Fourth-year students somewhat
- verrepresented, while first-
year students are somewhat underrepresented. White students are somewhat
- verrepresented, while
international students are somewhat underrepresented. Other ethnic groups are represented proportionally among respondents.
0% 10% 20% 30% 40% 50% 60% 70%
White, not of Hispanic or … Nonresident Alien Hispanic or Latino(a) Asian Race and Ethnicity unknown African American or Black Multi-Racial Alaskan Native or American Indian Native Hawaiian or Other Pacific … Respondents by Ethnicity % Respondents % Population