
SLIDE 1
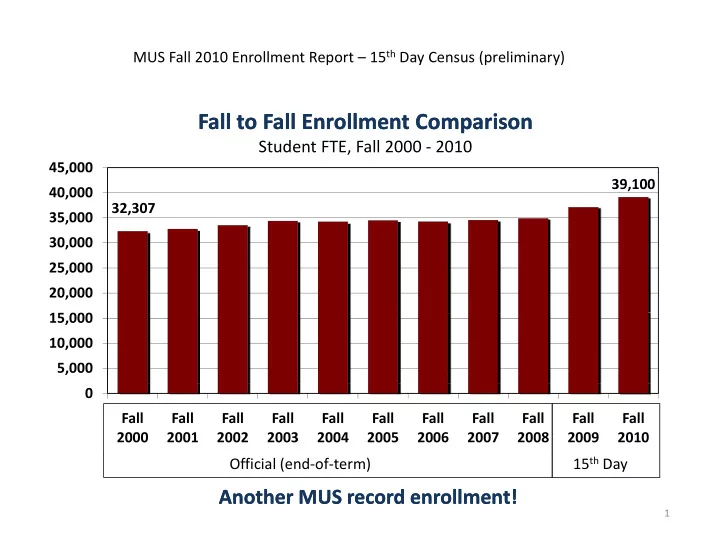
MUS Fall 2010 Enrollment Report – 15th Day Census (preliminary)
45,000
Fall to Fall Enrollment Comparison Fall to Fall Enrollment Comparison
Student FTE, Fall 2000 ‐ 2010
32,307 39,100 30 000 35,000 40,000 , 15 000 20,000 25,000 30,000 5,000 10,000 15,000 Fall 2000 Fall 2001 Fall 2002 Fall 2003 Fall 2004 Fall 2005 Fall 2006 Fall 2007 Fall 2008 Fall 2009 Fall 2010
15th Day Official (end‐of‐term)
Another MUS record enrollment! Another MUS record enrollment!
1