
SLIDE 1
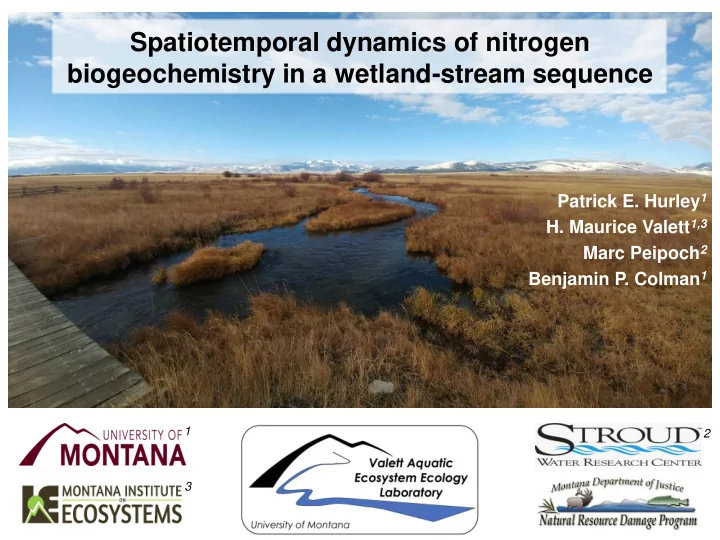
Spatiotemporal dynamics of nitrogen biogeochemistry in a wetland-stream sequence
Patrick E. Hurley1
- H. Maurice Valett1,3
Marc Peipoch2 Benjamin P. Colman1
1 2 3
Spatiotemporal dynamics of nitrogen biogeochemistry in a - - PowerPoint PPT Presentation
Spatiotemporal dynamics of nitrogen biogeochemistry in a wetland-stream sequence Patrick E. Hurley 1 H. Maurice Valett 1,3 Marc Peipoch 2 Benjamin P. Colman 1 1 2 3 Wetland-Stream Interactions Fluvial wetlands act as hot spots of
Patrick E. Hurley1
Marc Peipoch2 Benjamin P. Colman1
1 2 3
Caldwell et al. 2015; Montgomery 1999
WWTP
Whole Reach Bed Area (km2)
Wetlands (km2) Channel Bed Area (km2) Open Water (km2) Incision Ratio
Wetlands (km2) Incision Ratio
Median Travel Time (hrs)
a b b b
inputs
net groundwater exchange
MC1 MC2
Whole Reach Bed Area (km2)
inputs
ΔL due to groundwater exchange ΔL due to biogeochemical processing total change in load
Reach
b a¥ b b ab¥ a¥ ab b ab¥ a¥ ab¥ b ab¥ b¥ a¥ a
UNO3 > 0 = production UNO3 < 0 = removal
+
[NH4
+]
Bernal et al. 2017
Project Partners:
Doug Martin, MT NRDP Jim Ford, MT NRDP Beau Downing, MT NRDP Tom Parker, Geum Consulting Marisa Sowles, Geum Consulting Heggelund Ranch Ueland Ranch Kelley Ranch Lambert Ranch
Field & Lab Techs:
Kim Bray Claire Utzman Fischer Young Kate Perkins Lauren Sullivan Ash Micklewright Carly Andlauer
"This material is based upon work supported in part by the National Science Foundation EPSCoR Cooperative Agreement OIA-1757351"