Biogeochemistry Biogeochemistry and Natural and Natural - - PowerPoint PPT Presentation

biogeochemistry biogeochemistry and natural and natural
SMART_READER_LITE
LIVE PREVIEW

Biogeochemistry Biogeochemistry and Natural and Natural - - PowerPoint PPT Presentation

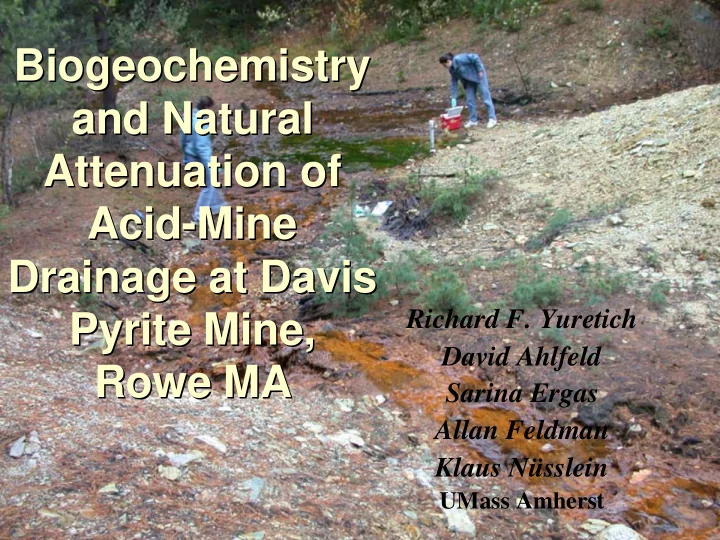
Biogeochemistry Biogeochemistry and Natural and Natural Attenuation of Attenuation of Acid- -Mine Mine Acid Drainage at Davis Drainage at Davis Richard F. Yuretich Pyrite Mine, Pyrite Mine, David Ahlfeld Rowe MA Rowe MA Sarina


slide-1
SLIDE 1

Biogeochemistry Biogeochemistry and Natural and Natural Attenuation of Attenuation of Acid Acid-

  • Mine

Mine Drainage at Davis Drainage at Davis Pyrite Mine, Pyrite Mine, Rowe MA Rowe MA

Richard F. Yuretich David Ahlfeld Sarina Ergas Allan Feldman Klaus Nüsslein

UMass Amherst

slide-2
SLIDE 2

Davis Mine

  • Town of Rowe, MA
  • Remains of an

abandoned pyrite mine

  • Small area

– Ore body: 15 ha – AMD area: 3-4 ha

slide-3
SLIDE 3

Davis Mine

Acidic Mine Effluent 100 m Shaft #1

slide-4
SLIDE 4

Geology

  • f Davis Mine
  • Located in northwestern

Massachusetts.

  • Sulfide mineralization

primarily (Fe)-Cu-Zn, low Pb and As.

  • Scattered sulfide ore

bodies along NE-SW trend.

  • Hydrothermal origin

related to arc volcanism

slide-5
SLIDE 5

Davis Mine, Rowe, MA

  • Pyrite extracted from 1886

until 1910.

  • Collapsed because of poor

mining practices.

Shaft #1

slide-6
SLIDE 6

Davis Mine, Rowe, MA

  • Leaching acidity, iron, sulfate, and other metals into

nearby brook

Shaft #1

slide-7
SLIDE 7

pH Cond Na Fe Zn Cl SO4 SiO2 Normal 5.7 20 2.2 0.27 0.08 2.61 8.12 5.14 Effluent 3.19 134 5.75 22.5 4.51 5.32 178.5 26.7

Pristine vs. Impacted Water

slide-8
SLIDE 8

Initial Monitoring Network

  • Mine effluent drains

from Shaft #1 into Davis Mine Brook.

  • Three sampling points

along effluent stream.

slide-9
SLIDE 9

Site 1 Mine Shaft Well #2

slide-10
SLIDE 10

Site 2 Well #8

slide-11
SLIDE 11

Well #13

slide-12
SLIDE 12

pH, SO4 in Mine Effluent

50 100 150 200 250

SO4

Concentration (mg/l) 2.85

3.17 3.07 2.97

2.90 2.95 3.00 3.05 3.10 3.15 3.20

Site #1 Site #2 Site #3

pH

slide-13
SLIDE 13

Trace Elements in Mine Effluent

0.00 5.00 10.00 15.00 20.00 25.00 30.00 35.00 40.00 Fe Mn Al Cu Zn Concentration (mg/l)

33.80 0.51 2.26 0.79 4.59

Site #1

14.36 0.59 2.88 0.65 4.07

Site #2

23.57 1.27 3.83 0.97 4.89

Site #3

Fe, Zn highest at mine entrance Precipitates via oxidation downstream Augmented by groundwater from tailings Mn, Al, (Cu) increase downstream

slide-14
SLIDE 14

Present Study

  • Impacts upon

Davis Mine Brook downstream from effluent

  • Biogeochemistry
  • f natural

attenuation

slide-15
SLIDE 15

Davis Mine Brook: A4 to B4

slide-16
SLIDE 16

Davis Mine Brook: Well 2 and Power Lines

slide-17
SLIDE 17

pH, SO4 in Davis Mine Brook

Downstream 5 10 15 20 25 30

Concentration mg/l

Mine Effluent Input A4 B1 B2 B3 B4 W 2 P. L.

  • S. X

3.50 4.00 4.50 5.00 5.50 6.00 pH

Mine Effluent Input

A4 B1 B2 B3 B4 W 2 P. L.S. X Downstream

slide-18
SLIDE 18

Trace Elements: Davis Mine Brook

Zn, Al, most persistent trace elements Fe disappears more rapidly downstream Dilution by tributary has greatest effect Brook “macrobiota- free” for ~5 km

0.00 0.50 1.00 1.50 2.00 2.50 Fe Mn Zn Cu Al Concentration (mg/l) Stream Xing B1 B2 B3 B4 Near Well 2 Power Lines Stream Xing

slide-19
SLIDE 19

Groundwater

  • Hand-augur wells

1994-95

  • Multi-level monitoring

wells installed April, 2003

  • Geochemical and

hydrological modeling

  • Assessment of rates and

mechanisms of natural remediation

  • Documentation of

sulfate and iron- reducing bacteria

slide-20
SLIDE 20

Groundwater Wells

Shallow wells 1994-95 Multilevel wells Installed April, 2003

slide-21
SLIDE 21
  • Acidification of

groundwater locally intense

  • Extreme values found

in old tailings piles

  • Ambient groundwater

from unimpacted areas helps restrict the AMD zone

slide-22
SLIDE 22
  • Iron “hot zone”

confined to small area

  • f groundwater.
  • Greater extension to S

down Davis Mine Brook.

  • Reflects the more

complicated redox and solubility behavior of Fe.

slide-23
SLIDE 23
  • Sulfate shows

extensive area of elevated concentration.

  • Reduction only

possible removal mechanism

slide-24
SLIDE 24

Down Gradient Trends

  • Three 1994-95

shallow wells ~1m deep

slide-25
SLIDE 25

Trace Elements in Groundwater

0.00 5.00 10.00 15.00 20.00 25.00 30.00 35.00 40.00 45.00 Fe Mn Al Cu Zn Concentration (mg/l)

9.17 0.46 1.82 0.53 3.36

Well #2

32.44 2.14 6.55 1.76 12.35

Well #8

40.65 1.30 6.83 2.05 6.76

Well #13

Fe, Al, Cu increase down gradient Mn, Zn highest in Well #8, where hydraulic conductivity is lowest

slide-26
SLIDE 26

Considerations

  • Low pH limits ability of oxyhydroxides to

absorb Zn, Cu

  • H2S odor noticeable is some areas = active

sulfate reduction by anaerobic microorganisms?

  • CuS has lower solubility than ZnS, so Cu

would be scavenged preferentially on sulfide precipitates

slide-27
SLIDE 27

Secular Variations in Groundwater

Zn in Groundwater

2 4 6 8 10 12 14 16 3/7/94 4/26/94 6/15/94 8/4/94 9/23/94 11/12/9 4 1/1/95 2/20/95 4/11/95 Concentration (mg/l)

Well #2 Well #8 Well #13

slide-28
SLIDE 28

Secular Variations in Groundwater

Cu in Groundwater

1 2 3 4 5 6 7 8 9 10 3/7/94 4/26/94 6/15/94 8/4/94 9/23/94 11/12/94 1/1/95 2/20/95 4/11/95 Concentration (mg/l)

Well #2 Well #8 Well #13

slide-29
SLIDE 29

Secular Variations in Groundwater

Zn/Cu Ratio in Groundwater

0.00 2.00 4.00 6.00 8.00 10.00 12.00 14.00 16.00 18.00 3/7/94 4/26/94 6/15/94 8/4/94 9/23/94 11/12/94 1/1/95 2/20/95 4/11/95 Concentration Ratio

Well #2 Well #8 Well #13

slide-30
SLIDE 30

Natural Remediation?

  • Active microbial sulfate reduction promotes

preferential removal of dissolved Cu on precipitated sulfides.

  • High Zn/Cu ratios in groundwater point

towards this process.

  • Seasonal patterns reflect variations in

microbial activity.

slide-31
SLIDE 31

y = 0.6907x + 15.37 R2 = 0.2083 200 400 600 800 1000 100 200 300 400 500 600 ORP (mV) Sulfate (mg/ l)

Additional evidence of sulfate reduction

slide-32
SLIDE 32

Cultivating Reducing Bacteria

slide-33
SLIDE 33

Sulfate-reducing bacteria are present in this environment

slide-34
SLIDE 34

Ongoing research supported by the National Science Foundation “Biocomplexity in the Environment” Program CHE-0221791

Ongoing Investigation Ongoing Investigation

  • Continued field monitoring

Continued field monitoring

  • Column studies to model geochemistry

Column studies to model geochemistry

  • DNA identification

DNA identification

  • Enrichment cultures and community ID

Enrichment cultures and community ID

  • Benefits of research to K12 teachers

Benefits of research to K12 teachers

slide-35
SLIDE 35

Ongoing research supported by the National Science Foundation “Biocomplexity in the Environment” Program CHE-0221791

Thanks to the Team! Thanks to the Team!

  • Jessica Bloom

Jessica Bloom

  • Liam

Liam Bevan Bevan

  • Melissa Russell

Melissa Russell

  • Mercedita

Mercedita Monserrate Monserrate

  • Krissy

Krissy Forloney Forloney

  • Phil Dixon

Phil Dixon

  • Cristine

Cristine Barreto Barreto

  • Jason Jean

Jason Jean

  • Janice Wing

Janice Wing

  • Jaime Harrison

Jaime Harrison

  • Melinda Solomon

Melinda Solomon