
Spatiotemporal dynamics of N and C biogeochemistry along a wetland-stream sequence
Patrick Hurley1 | H. Maurice Valett1 | Marc Peipoch2
1University of Montana | 2Stroud Water Research Center | patrick1.hurley@umontana.edu
- 1. Lost Creek Dutchman Complex (LCDC)
- 2. Nutrient Patterns over Time and Space
- 3. Groundwater flowpaths drive N processing
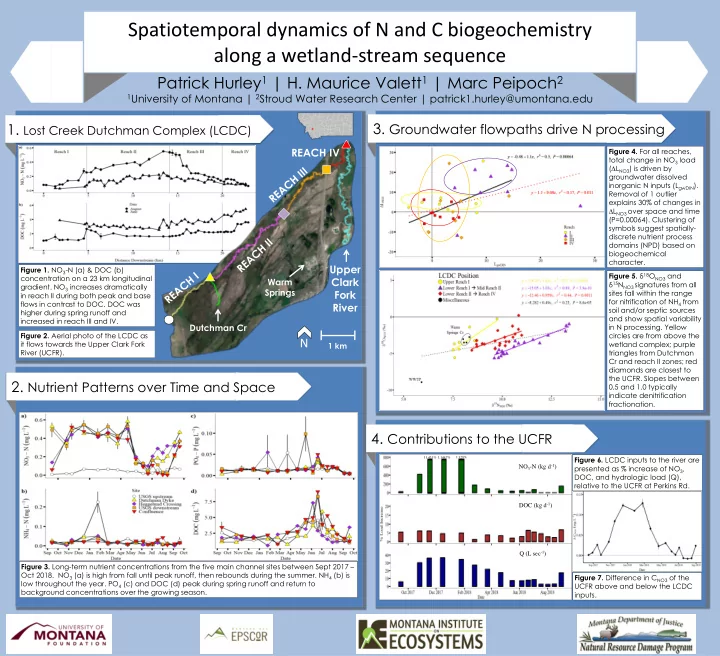
Figure 2. Aerial photo of the LCDC as it flows towards the Upper Clark Fork River (UCFR). Figure 1. NO3-N (a) & DOC (b) concentration on a 23 km longitudinal
- gradient. NO3 increases dramatically
in reach II during both peak and base flows in contrast to DOC. DOC was higher during spring runoff and increased in reach III and IV. Figure 3. Long-term nutrient concentrations from the five main channel sites between Sept 2017 – Oct 2018. NO3 (a) is high from fall until peak runoff, then rebounds during the summer. NH4 (b) is low throughout the year. PO4 (c) and DOC (d) peak during spring runoff and return to background concentrations over the growing season.
REACH IV
1 km
N
Dutchman Cr
Upper Clark Fork River
Warm Springs
Figure 4. For all reaches, total change in NO3 load (∆LNO3) is driven by groundwater dissolved inorganic N inputs (LgwDIN). Removal of 1 outlier explains 30% of changes in ∆LNO3 over space and time (P=0.00064). Clustering of symbols suggest spatially- discrete nutrient process domains (NPD) based on biogeochemical character. Figure 5. δ18ONO3 and δ15NNO3
signatures from all
sites fall within the range for nitrification of NH4 from soil and/or septic sources and show spatial variability in N processing. Yellow circles are from above the wetland complex; purple triangles from Dutchman Cr and reach II zones; red diamonds are closest to the UCFR. Slopes between 0.5 and 1.0 typically indicate denitrification fractionation.
- 4. Contributions to the UCFR
NO3-N (kg d-1) DOC (kg d-1) Q (L sec-1)
11,431% 1,1447% 1,328%
Figure 6. LCDC inputs to the river are presented as % increase of NO3, DOC, and hydrologic load (Q), relative to the UCFR at Perkins Rd. Figure 7. Difference in CNO3 of the UCFR above and below the LCDC inputs.