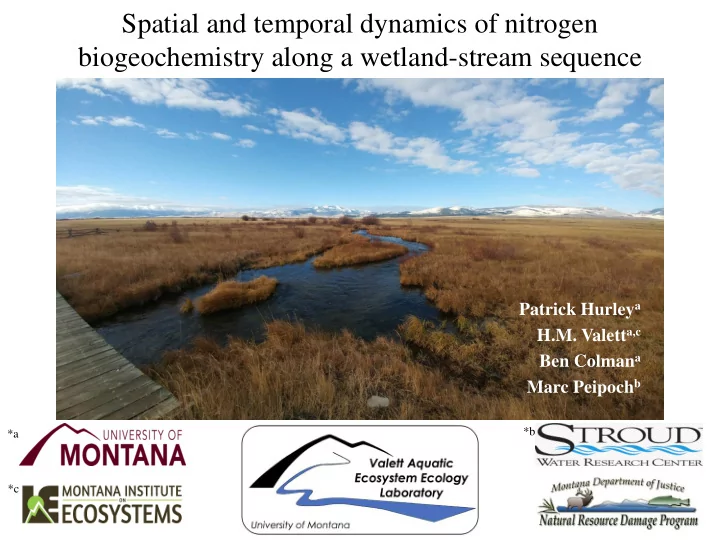

Spatial and temporal dynamics of nitrogen biogeochemistry along a wetland-stream sequence Patrick Hurley a H.M. Valett a,c Ben Colman a Marc Peipoch b *b *a *c
Acknowledgements Project Partners: Field & Lab Techs: Jim Ford, NRDP Claire Utzman Doug Martin, NRDP Ash Micklewright Beau Downing, NRDP Fischer Young Marisa Sowles, Geum Consulting Kate Perkins Tom Parker, Geum Consulting Carly Andlauer Heggelund Ranch Kim Bray Ueland Ranch Kelley Ranch Lambert Ranch
Nutrients in the Upper Clark Fork River (UCFR) P N and P spikes in the UCFR N Ingman & Kerr 1989
Longitudinal Study Clark Fork Coalition MT DNRC
UCFR Longitudinal Nitrate 80.0 October 2016 October-NO3 Lost Creek 70.0 April 2017 April-NO3 UCFR 60.0 Nitrate-N (ug/L) 50.0 40.0 30.0 20.0 10.0 0.0 0 10 20 30 40 River km from Warm Springs Put-in Valett & Peipoch 2018
Warm Springs Put-in Warm Springs Creek Silver Bow Creek
Research Questions I. How does biogeochemical processing change along a wetland-stream sequence? II. How do spatial and temporal patterns characterize nutrient dynamics in linked ecosystems?
Project Summary Outputs – Inputs = Using a mass-balance Nutrient Processing? approach…. Silverthorn 2015 Key objectives: 1. Characterize biogeochemical dynamics of wetland-stream sequence 2. Quantify nutrient magnitude, processing efficiency, and fate over time and space 3. Identify drivers of material cycling and delivery to the UCFR
Lost Creek Dutchman Complex (LCDC) MT’s largest peat fen 22 km channel 157 km 2 catchment 150 L/sec baseflow 0.5 km 2 of open water 11.5 km 2 of wetlands
Math Load Calculation 𝑀 𝑦 = 𝑅 𝑦 ∗ [ 𝑜𝑜𝑜𝑜𝑜𝑜𝑜𝑜 ] 𝑦 𝑛𝑛 𝑀 𝑛𝑛 𝑙𝑛 𝑡𝑡𝑡 = 𝑡𝑡𝑡 ∗ ∗ 0.0864 𝑒𝑏𝑏 𝑀 Mass Balance Biology? Hydrology? 𝑀 𝑝𝑝𝑝 = 𝑀 𝑗𝑗 + 𝑀 𝑝 − 𝑀 𝑚 + Δ𝑀 t=tributary; l=irrigation losses
Nitrate concentration over time and space Site 3 Site 3 Upstream Site 6 Site 6 Site 9 Site 9 Site 11 Site 11 Site 12 Downstream Site 12 May 15 June 19 15 MAY 19 JUNE July 17 August 14 Sept. 19 17 JULY 14 AUGUST 19 SEPT. DATE
Nitrate loads over time and space Site 3 Upstream Site 6 Site 9 Site 11 Site 12 Downstream May 15 June 19 15 MAY 19 JUNE July 17 August 14 Sept. 19 17 JULY 14 AUGUST 19 SEPT. DATE
Nitrate concentration on a 22km gradient Reach I Reach II Reach III Reach IV Diversion Dam AUGUST 22 JUNE 7
June L NO3 vs. net groundwater exchange Reach I Reach II Reach III Reach IV -64% 18% 60% 14%
August L NO3 vs. net groundwater exchange Reach I Reach II Reach III Reach IV -194% -27% 51% 6% Diversion Dam
Baseflow groundwater N concentrations n = 20 Mean NH 4 -N Mean NO 3 -N NO 3 -N NH 4 -N FORM
Ground-surfacewater interactions & microbial processing: implications for N loads in the LCDC Reach I Reach II Reach III Reach IV Dutchman Creek *Nitrification of NH 4 -N from anoxic Dutchman Dyke groundwater to NO 3 -N at oxic Lost Creek Fen hyporheic interface
Contributions to the UCFR L NO3 % Increase Relative to UCFR L NH4 Q Peak Flood May 15 June 19 15 MAY 06 JUNE July 17 August 14 Sept. 19 19 JUNE 03 JULY DATE
Questions?
Nitrate loads on a 22km gradient Reach 1 Reach 2 Reach 3 Reach 4 June 7 August 15
Ammonium concentration over time Site 3 Site 6 Site 9 Site 11 Site 12 May 15 June 19 July 17 August 14 Sept. 19
Ammonium loads over time Site 3 Site 6 Site 9 Site 11 Site 12 May 15 June 19 July 17 August 14 Sept. 19
Phosphate concentration over time Site 3 Site 6 Site 9 Site 11 Site 12 May 15 June 19 July 17 August 14 Sept. 19
Phosphate loads over time Site 3 Site 6 Site 9 Site 11 Site 12 May 15 June 19 July 17 August 14 Sept. 19
DOC concentration over time Site 3 Site 6 Site 9 Site 11 Site 12 May 15 June 19 July 17 August 14 Sept. 19
DOC loads over time Site 3 Site 6 Site 9 Site 11 Site 12 May 15 June 19 July 17 August 14 Sept. 19
DOC concentrations on a 22km gradient Reach 1 Reach 2 Reach 3 Reach 4
DOC loads on a 22km gradient Reach 1 Reach 2 Reach 3 Reach 4
Δ L along a 22km gradient Reach 1 Reach 2 Reach 3 Reach 4 June 7
Δ L along a 22km gradient Reach 1 Reach 2 Reach 3 Reach 4 June 7 August 22
Recommend
More recommend