
SLIDE 1
1
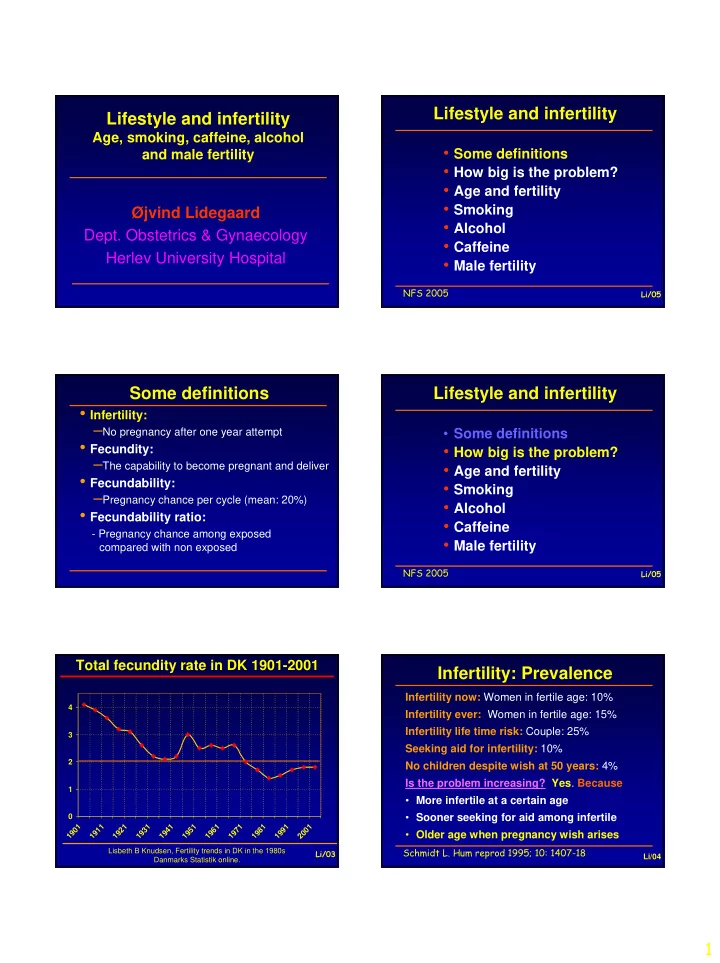
Lifestyle and infertility
Age, smoking, caffeine, alcohol and male fertility
Øjvind Lidegaard
- Dept. Obstetrics & Gynaecology
Herlev University Hospital
Lifestyle and infertility
- Some definitions
- How big is the problem?
- Age and fertility
- Smoking
- Alcohol
- Caffeine
- Male fertility
NFS 2005
Li/05
Some definitions
- Infertility:
–No pregnancy after one year attempt
- Fecundity:
–The capability to become pregnant and deliver
- Fecundability:
–Pregnancy chance per cycle (mean: 20%)
- Fecundability ratio:
- Pregnancy chance among exposed
compared with non exposed
Lifestyle and infertility
- Some definitions
- How big is the problem?
- Age and fertility
- Smoking
- Alcohol
- Caffeine
- Male fertility
NFS 2005
Li/05
Total fecundity rate in DK 1901-2001
Lisbeth B Knudsen, Fertility trends in DK in the 1980s Danmarks Statistik online. Li/03 1 2 3 4 1 9 1 1 9 1 1 1 9 2 1 1 9 3 1 1 9 4 1 1 9 5 1 1 9 6 1 1 9 7 1 1 9 8 1 1 9 9 1 2 1
Infertility: Prevalence
Infertility now: Women in fertile age: 10% Infertility ever: Women in fertile age: 15% Infertility life time risk: Couple: 25% Seeking aid for infertility: 10% No children despite wish at 50 years: 4% Is the problem increasing? Yes. Because
- More infertile at a certain age
- Sooner seeking for aid among infertile
- Older age when pregnancy wish arises
Schmidt L. Hum reprod 1995; 10: 1407-18
Li/04