SLIDE 1
SIO15-SS1 20: Topic 17: Heat Waves and Great Storms
SLIDE 2
SIO15-SS1 20: Topic 17: Heat Waves and Great Storms
SLIDE 3
SIO15-SS1 20: Topic 17: Heat Waves and Great Storms
SLIDE 4
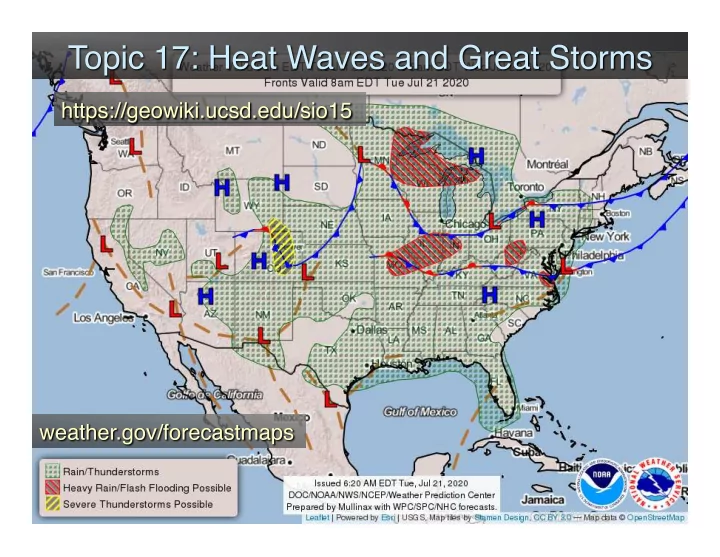
SIO15-SS1 20: Topic 17: Heat Waves and Great Storms
SLIDE 5
SIO15-SS1 20: Topic 17: Heat Waves and Great Storms
highest T (global): 58ºC (136ºF) Libya (until 2012) (N.A.): 57ºC (134ºF) Death Valley, CA lowest T (global): -89ºC (-129ºF) Vostok, Antarctica (N.A.): -63ºC (-81ºF) Yukon, Canada Mercury: day: 427ºC night: -173ºC Venus: day/night: 462ºC (865ºF) Mars: day: 20ºC night: -140ºC top of troposphere: -60ºC (-80ºF)
SLIDE 6
SIO15-SS1 20: Topic 17: Heat Waves and Great Storms
Heat is s cu curre rrently y #1 ki killer and co cost sts s mo most st!
deadly 2003 European heat wave deadly 2010 Russia heat wave
SLIDE 7 SIO15-SS1 20: Topic 17: Heat Waves and Great Storms
high crime rate
- > people afraid of opening windows
SLIDE 8
SIO15-SS1 20: Topic 17: Heat Waves and Great Storms
SLIDE 9 SIO15-SS1 20: Topic 17: Heat Waves and Great Storms
humid air: sweat can’t evaporate
Fig 13.10
Urban heat island:
* Paved surfaces retain heat * Lack of trees
SLIDE 10
SIO15-SS1 20: Topic 17: Heat Waves and Great Storms
Fig 13.33
SLIDE 11 SIO15-SS1 20: Topic 17: Heat Waves and Great Storms
Massi ssive ve dust st st storms rms
Aggre ressi ssive ve Ag Agri ricu culture re
Soil Ero Erosi sion (a (acro cross ss At Atlantic) c)
In U.S. S., it take kes s 30 ye year r to Gro row 1 inch ch of topso soil
SLIDE 12
SIO15-SS1 20: Topic 17: Heat Waves and Great Storms
SLIDE 13
SIO15-SS1 20: Topic 17: Heat Waves and Great Storms
SLIDE 14
SIO15-SS1 20: Topic 17: Heat Waves and Great Storms
SLIDE 15
SIO15-SS1 20: Topic 17: Heat Waves and Great Storms
SLIDE 16
SIO15-SS1 20: Topic 17: Heat Waves and Great Storms
greatest cold wave in U.S.: 10-14 Feb 1899 (Tallahassee -2ºF ; snow in New Orleans, 6.8ºF; ice floes into Gulf of Mexico) 100 deaths
also known as: “Great Arctic Outbreak of 1899” “Great Blizzard of 1899”
source: Wikipedia
Snowball fight at Capitol Tallahassee
SLIDE 17
SIO15-SS1 20: Topic 17: Heat Waves and Great Storms
Fig 13.19
SLIDE 18
SIO15-SS1 20: Topic 17: Heat Waves and Great Storms
SLIDE 19
SIO15-SS1 20: Topic 17: Heat Waves and Great Storms
SLIDE 20 SIO15-SS1 20: Topic 17: Heat Waves and Great Storms source: S.D. Union Tribune
Arctic air mass from Siberia more typical for mid- January
northern New England
- Chicago 7ºF (for date, 1986)
- St. Louis 11ºF (for date, 1911)
- snowfall records in Buffalo, Detroit
- dust of snow in Memphis, TN
- early frozen lakes in MN
11/13/19
SLIDE 21
SIO15-SS1 20: Topic 17: Heat Waves and Great Storms
jet streams steer air masses/storms
source: S.D. Union Tribune
SLIDE 22 SIO15-SS1 20: Topic 17: Heat Waves and Great Storms source: NSF/Wikipedia
2014 “Polar Vortex” event
- Dec 1 – Apr 10
- $5 billion damage
- 21 fatalities
- 200 M people affected
(transportation/electricity) record T broken 5-7 Jan: (7 Jan, > 49 record lows across country) Green Bay, WI -18ºF (1979) Chicago O’Hare, -16ºF (1184/1988) Babbitt, MN -37ºF coldest in U.S. 6 Jan Atlanta, GA 6ºF (1970) Dallas, TX 16ºF (??)
SLIDE 23
SIO15-SS1 20: Topic 17: Heat Waves and Great Storms
SLIDE 24
SIO15-SS1 20: Topic 17: Heat Waves and Great Storms
SLIDE 25 SIO15-SS1 20: Topic 17: Heat Waves and Great Storms
SLIDE 26 SIO15-SS1 20: Topic 17: Heat Waves and Great Storms
SLIDE 27
SIO15-SS1 20: Topic 17: Heat Waves and Great Storms