
SLIDE 1
1
Cashflow
- The significance to the contractor’s
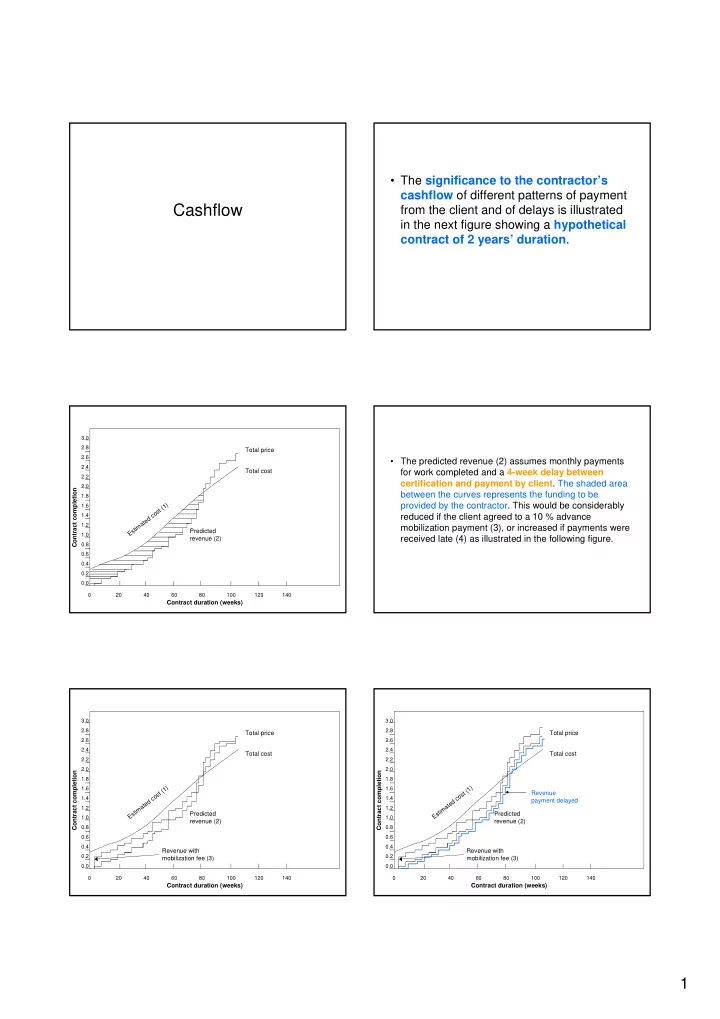
cashflow of different patterns of payment from the client and of delays is illustrated in the next figure showing a hypothetical contract of 2 years’ duration.
3.0 2.8 2.6 2.4 2.2 2.0 1.8 1.6 1.4 1.2 1.0 0.8 0.6 0.4 0.2 0.0 20 40 60 80 100 120 140
E s t i m a t e d c
- s
t ( 1 ) Total price Total cost Predicted revenue (2) Contract completion Contract duration (weeks)
- The predicted revenue (2) assumes monthly payments
for work completed and a 4-week delay between certification and payment by client. The shaded area between the curves represents the funding to be provided by the contractor. This would be considerably reduced if the client agreed to a 10 % advance mobilization payment (3), or increased if payments were received late (4) as illustrated in the following figure.
3.0 2.8 2.6 2.4 2.2 2.0 1.8 1.6 1.4 1.2 1.0 0.8 0.6 0.4 0.2 0.0 20 40 60 80 100 120 140
E s t i m a t e d c
- s
t ( 1 ) Total price Total cost Predicted revenue (2) Contract completion Contract duration (weeks) Revenue with mobilization fee (3)
3.0 2.8 2.6 2.4 2.2 2.0 1.8 1.6 1.4 1.2 1.0 0.8 0.6 0.4 0.2 0.0 20 40 60 80 100 120 140
E s t i m a t e d c
- s
t ( 1 ) Total price Total cost Predicted revenue (2) Contract completion Contract duration (weeks) Revenue with mobilization fee (3) Revenue payment delayed