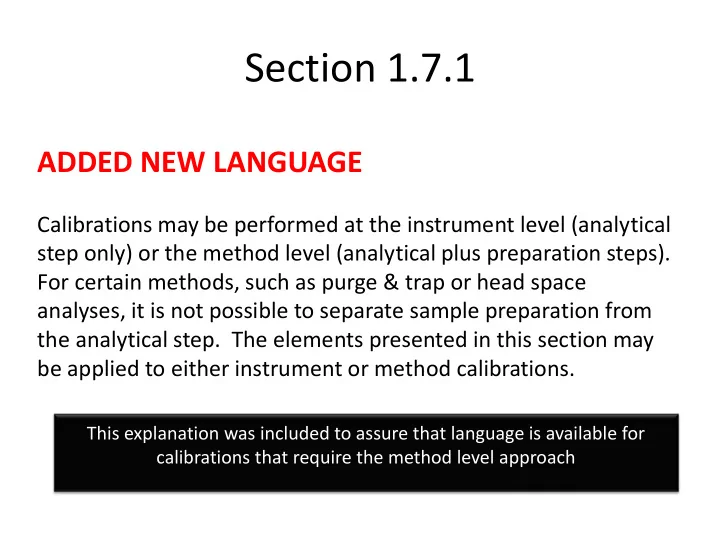
Section 1.7.1 ADDED NEW LANGUAGE Calibrations may be performed at - - PowerPoint PPT Presentation

β–Ά
section 1 7 1
SMART_READER_LITE
LIVE PREVIEW

Section 1.7.1 ADDED NEW LANGUAGE Calibrations may be performed at - - PowerPoint PPT Presentation

Section 1.7.1 ADDED NEW LANGUAGE Calibrations may be performed at the instrument level (analytical step only) or the method level (analytical plus preparation steps). For certain methods, such as purge & trap or head space analyses, it is


slide-1
SLIDE 1

Section 1.7.1

ADDED NEW LANGUAGE

Calibrations may be performed at the instrument level (analytical step only) or the method level (analytical plus preparation steps). For certain methods, such as purge & trap or head space analyses, it is not possible to separate sample preparation from the analytical step. The elements presented in this section may be applied to either instrument or method calibrations.

This explanation was included to assure that language is available for calibrations that require the method level approach

slide-2
SLIDE 2

Section 1.7.1.1

Added new c)

  • c. the laboratory shall use the most recent

initial calibration standard(s) analyzed prior to the analytical batch, unless otherwise specified by this standard;

  • c. was added to assure that analysts use a calibration that best reflects current

instrument conditions, and to prohibit the use of an β€œold” curve when the new one failed.

slide-3
SLIDE 3

Added new d)

  • d. criteria shall be established by the laboratory for the

rejection of any calibration standards analyzed but not used to generate an initial calibration. The reason for the rejection of any calibration standard shall be documented and no data below the lowest or above the highest remaining calibration standard shall be quantitatively reported (see also h and i). The calibration generated from the remaining calibration standards shall satisfy all the requirements specified for initial calibrations.

  • d. was added to require clarity on the removal of calibrants from a curve..

The statement regarding data reporting only within the range of the calibrants is emphasized to assure that when the lowest or highest calibrant is removed, the range of results that can be reported unqualified is decreased.

slide-4
SLIDE 4

Added new h)

  • h. A measure of relative error in the calibration shall be used

(correlation coefficient or coefficient of determination alone are not sufficient) for all calibrations created using a regression

  • analysis. This analysis may be performed by either:

h.) was added to address a weakness -currently there is often no requirement for measurement of relative error in a curve except by the mid level CCV. This weakness conspires with the use of the correlation coefficient (which is insensitive to large relative error at the low end of the curve ) and results in frequent use of calibration curve that return highly inaccurate results.

slide-5
SLIDE 5

Option 1 for Relative error

Measurement of the residual error at or near the mid-point of the initial calibration and at the point closest to the LOQ. The error at these levels must be less than or equal the maximum specified in the method. If no criterion for the LOQ level is specified in the method, an appropriate level shall be specified in the laboratory SOP. Residual error is calculated by re-fitting the calibration data back to the model, using the following equation: (where re-fitting is not possible, assessment may be performed by analyzing the standards at the appropriate levels).

Providing a simple way to assess relative error possible with all data systems.

% π‘†π‘“π‘‘π‘—π‘’π‘£π‘π‘š 𝐹𝑠𝑠𝑝𝑠 = 𝑦𝑗 βˆ’ 𝑦𝑗

β€²

𝑦𝑗 Γ— 100

slide-6
SLIDE 6

Option 2 for Relative Error

Measurement of the Relative Standard Error (RSE). The RSE shall be less than or equal to the maximum specified in the method. If no level is specified in the method, an appropriate level shall be specified in the laboratory SOP. RSE is calculated by re-fitting the calibration data back to the model, using the following equation:

RSE is an option that has recently been introduced into 40 CFR Part 136 and a pending version of SW-846 Method 8000

slide-7
SLIDE 7

Option 2 for Relative Error

% 𝑆𝑇𝐹 = 100 Γ— 𝑦𝑗

β€² βˆ’ 𝑦𝑗

𝑦𝑗

2 π‘œ 𝑗=1

(π‘œ βˆ’ π‘ž)

  • xi = True value of the calibration level i.
  • x’i = Measured concentration at level i.
  • p = Number of terms in the fitting equation.
  • (average = 1, linear = 2, quadratic = 3).
  • n = Number of calibration points.

When measured for an average curve fit, RSE is numerically the save value as the Relative Standard Deviation. RSE simply allows use of a RSD type measure for any type of calibration curve (linear, quadratic, etc).

slide-8
SLIDE 8

Phosphate Linear unforced Linear Forced Linear 1/x Linear 1/X2 0.05 651248 218.38%

  • 25.53%

9.91% 0.30% 0.5 7605083 12.10%

  • 7.49%
  • 3.50%
  • 2.15%

2.5 38175481

  • 4.32%
  • 7.07%
  • 5.43%
  • 3.23%

5 79141773 10 1.66E+08 0.85% 1.21% 2.33% 4.50% r 0.9997 0.9995 0.9996 0.9995 RSE 99.36% 11.37% 6.06% 3.48%

Example of the need for a Relative Error Measurement

  • 2.66%
  • 3.29%
  • 1.99%

0.23%

slide-9
SLIDE 9

Section 1.7.1.1

Added new i) and j)

i) the lowest calibration standard shall be at or below the LOQ. Any data reported below the LOQ shall be considered to have an increased measurement uncertainty and shall be reported using defined qualifiers or explained in the narrative ; j) the highest calibration standard shall be at or above the highest concentration for which quantitative data are to be reported. Any data reported above the calibration range shall be considered to have an increased measurement uncertainty and shall be reported using defined qualifiers or explained in the narrative;

The intent is the same as the existing language in f) and g). β€˜increased quantitative uncertainty’ was changed to β€˜increased measurement uncertainty’ to reinforce the concept that the specified uncertainty is inherent to the measurement process and is not limited to the process of converting response signals to quantitative results;

slide-10
SLIDE 10

Section 1.7.1.1

Added new k)

k) When test procedures are employed

that specify calibration with a single calibration standard and a zero point (blank or zero, however defined by the method), the following shall occur:

Corresponds to subsection 1.7.1.1(h) in the 2009 TNI standard;

slide-11
SLIDE 11

Section 1.7.1.1

Added new k)

i) Prior to calibration, the laboratory desired linear calibration range

  • f the instrument shall be established by analyzing a series of

standards, one of which shall be at or below the LOQ. To establish linearity, the requirements for a linear fit multi-point calibration included in this section (specifically 1.7.1.1 i and j) shall be met. Linearity must be established annually and checked at least quarterly with a standard at the top of the linear calibration range,

  • r at the frequency defined by the method.

ii) The zero point and single calibration standard within the linear calibration range shall be analyzed with each analytical batch and used to establish the slope of the calibration.

The frequency of establishing and verifying the linear range was defined; the frequency requirement in the 2009 standard was deemed to be inadequate or unclear; Calibration requirements for establishing the linear range were specified.

slide-12
SLIDE 12

Section 1.7.1.1

Added new k)

iii) To verify adequate sensitivity a standard at or below the LOQ shall also be analyzed with each calibration and shall meet the criteria established by the method or laboratory. The calibration and sensitivity evaluation shall be performed prior to sample analysis. iv) Sample results within the established linear calibration range will not require data qualifiers. Samples with results above the linear calibration range must be diluted, or the over-range results qualified as estimated values.

Other wording change were designed to improve clarity (such as clarifying that the sensitivity evaluation shall precede sample analysis); (Note – applies only to single point calibration methods)

slide-13
SLIDE 13

Section 1.7.1.1

Minimum number of calibration standards – Revised l)

  • As specified in reference or mandated method.
  • If not specified in the method, sufficient for at least

two statistical degrees of freedom.

– Except Threshold Testing: one standard at project specified threshold level.

Due to insufficient control of the number of levels in some methods

  • Minimum number based on calibration model
  • Calibration range to be considered (will be addressed in the guidance document)

Type of Calibration Minimum number Degrees of Freedom Threshold Testing 1 Not Applicable Average Response 3 2 Linear fit 4 2 Quadratic fit 5 2

slide-14
SLIDE 14

1.7.1.1 New section m

  • m) for multi-peak analytes (e.g., Arochlors,

technical chlordane, toxaphene) it is acceptable to perform an initial multi-point calibration for a subset of analytes (e.g., Arochlors 1016/1260 in PCB analysis) and to use a one-point initial calibration to determine the calibration factor and pattern recognition for the remaining analytes (if the assumption

  • f a linear model through the origin is

appropriate).

slide-15
SLIDE 15

Section 1.7.1.1

Multi-peak analytes - Added new m)

  • Initial multi point calibration for subset of analytes

(e.g., Aroclors 1016/1260 in PCB analysis)

  • One point initial calibration for remaining analytes (if

assumption of linear model through origin is appropriate) to determine:

– Calibration factor

– Pattern recognition

Currently no consistent calibration approach for multi-peak analytes

Proposed minimum specifications based on SW-846 method 8082A

slide-16
SLIDE 16

1.7.1.1 Revised section

  • n) any analytes detected in samples associated with

an initial calibration that does not meet the calibration criteria in the method or laboratory SOP shall, if reported, be qualified as estimated. Non-detected analytes may be reported without qualification in the event of calibration failures if the laboratory has performed a successful demonstration of adequate

  • sensitivity. This demonstration shall consist of analysis
  • f a standard at or below the reporting limit with each

analytical batch, with detection of all analytes in compliance with all applicable criteria for detection.

slide-17
SLIDE 17

Section 1.7.1.1

Requirements for non-detect analytes - Revised n)

  • Non-detected analytes can be reported without

qualification even if initial or continuing calibration criteria fail, if successful demonstration of sensitivity exists

  • Demonstration of sensitivity:

– Standard at or below reporting limit – Standard analyzed with each analytical batch – For methods that require bracketing continuing calibration verifications, bracketing demonstrations of sensitivity also required – All applicable criteria for detection met for all analytes

Different calibration/calibration verification criteria for non-detected analytes

slide-18
SLIDE 18

Section 1.7.2

Added new c)

c) The concentration of the calibration verification standard shall be equal to

  • r less than the mid-point of the

calibration range (as determined by the average of the highest and lowest calibration standard).

The current Standard is silent regarding the concentration of the continuing calibration verification as compared to the calibration range. It was considered important to ensure the continuing calibration analysis is performed at a suitable concentration.

slide-19
SLIDE 19

Section 1.7.2

Rewording of subsection d)

d)

Instrument continuing calibration verification shall be performed for methods that contain a calibration verification requirement.

Wording changes were designed to improve understanding and clarity.

slide-20
SLIDE 20

Section 1.7.2

Rewording of subsection d)

ii) When the defined time period for calibration or the most recent calibration verification has expired. iii) A starting continuing calibration verification is not required for an analytical batch that contains an initial calibration and an initial calibration verification.

Changes were designed to better clarify continuing calibration frequency when there is a defined time period in the method; and to more expressly state that continuing calibration is not needed when the batch or sequence begins with an initial calibration.

slide-21
SLIDE 21

Section 1.7.2

Rewording of subsection f.i)

i) When the acceptance criteria for

the continuing calibration verification are exceeded high (i.e., high bias) and there are associated samples that are non-detects, then those non-detects may be reported without qualification

Indicated that when a CCV has a high bias, reported non- detects do not require qualifiers.

slide-22
SLIDE 22

Section 1.7.2

Rewording of subsection f.ii)

ii)

When the acceptance criteria for the continuing calibration verification are exceeded low (i.e., low bias), those sample results may be reported as estimated values if they exceed a maximum regulatory limit/decision level.

Indicated that when a CCV has a low bias, sample results reported that are over a regulatory limit are qualified as estimated values.

slide-23
SLIDE 23

Section 1.7.2

New subsection f.iii)

iii)

Non-detected analytes that fail the continuing calibration verification low may be reported without qualification if a demonstration of adequate sensitivity (see section n of the Initial Calibration section) has been performed within the same analytical batch. For methods that require bracketing continuing calibration verification standards, bracketing demonstrations of sensitivity are also required.

Added the ability to report non-detect sample results when a CCV has a low bias, provided that the batch includes demonstration(s) of sensitivity.

slide-24
SLIDE 24

Section 1.7.2

New language – end of section f) on CCV criteria and reporting allowances:

Otherwise the samples affected by the unacceptable continuing calibration verification shall be re-analyzed after a new calibration curve has been established, evaluated and accepted.

Clarifies that only under the conditions listed can results associated with a failing CCV be reported. All other samples must be re-analyzed.

slide-25
SLIDE 25

Future Calibration Guidance Document

Main Items to be Covered

  • Introduction, Scope and Applicability
  • Normative References, Terms and Definitions
  • Calibration for Established Methods
  • Initial Calibration Assessment
  • Continuing Calibration Verification
  • Calibration Design for New Methods
  • Special Topics
slide-26
SLIDE 26

Future Calibration Guidance Document

Items that will be covered in more detail

  • Calibration for Established Methods

– Calibration Types – Benefits, Drawbacks and Requirements for each Type – Number of Calibration Points – Spacing of Calibration Points – Weighting – Calibration for Non-Detects – Methods with many analytes

slide-27
SLIDE 27

Future Calibration Guidance Document

Items that will be covered in more detail

  • Initial Calibration Assessment

– Rejection of Calibration Points – Selection of Calibration Curve Type – Comparison to Second Source Standard – Definition and Use of Correlation Coefficient (r) – Definition and Use of Percent Relative Standard Deviation (RSD%) – Definition and Use of Percent Relative Standard Error (RSE%) – Analysis of Residuals – Evaluation of Single Point Calibrations

slide-28
SLIDE 28

Future Calibration Guidance Document

Items that will be covered in more detail

  • Continuing Calibration Verification

– Frequency of the CCV – Concentration of the CCV – Assessment of the CCV – Special considerations for methods with many analytes – Special consideration for multi-response analytes (eg Aroclors) – Special considerations for single point calibrations

  • Special Topics

– Isotopic Dilution – Procedural Standards (calibration standards processed through the entire method) – Method of Standard Additions