may 2013
play

May 2013 Agenda Section 1 Jaypee Group Overview Section 2 Company - PowerPoint PPT Presentation

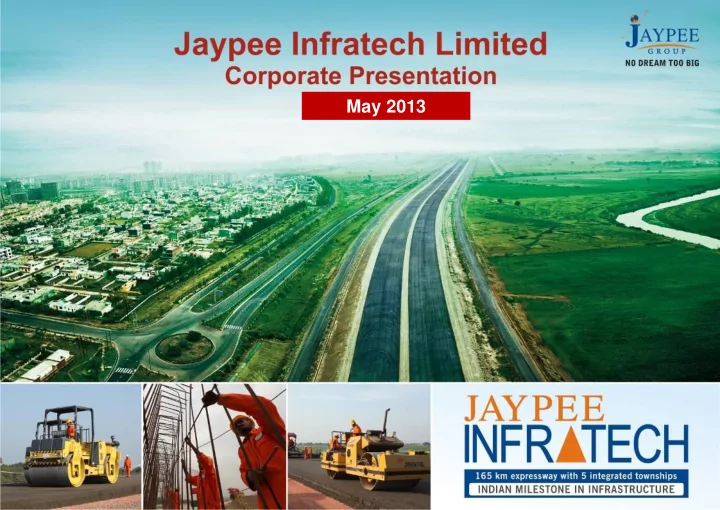
May 2013 Agenda Section 1 Jaypee Group Overview Section 2 Company Overview Section 3 Yamuna Expressway Progress Section 4 Real Estate Development Section 5 Financial Overview Section 6 Key Highlights 2 1 Section Jaypee Group Overview 3


  1. May 2013

  2. Agenda Section 1 Jaypee Group Overview Section 2 Company Overview Section 3 Yamuna Expressway Progress Section 4 Real Estate Development Section 5 Financial Overview Section 6 Key Highlights 2

  3. 1 Section Jaypee Group Overview 3

  4. Jaypee Group at a Glance Jaypee Group is a leading integrated infrastructure conglomerate in India with exposure to the power generation, cement, construction and real estate sectors  JAL has participated in  Largest Private Hydropower projects that have Group contributed to 27% of 1700 MW operational  India’s total Hydro Power Capacity Power Generation Thermal Power Engineering &  Construction 2x250 MW at Bina (Operational)  2x660 MW at Nigrie with captive coal  3x660 MW Bara Project   3rd Largest  165 km Yamuna Cement Group Expressway with 33.3 MTPA (Noida to Agra) capacity operational & 35.9 MTPA by FY 2014  Real Estate Development Cement Real Estate & Expressways Yamuna expressway:  530 Mn. Sq feet expected to be developed 33.3 MTPA capacity in operation 4

  5. Corporate Structure Jaiprakash Associates Limited (JAL) E&C Cement – 21.8 MTPA Listed company Real Estate & Hospitality BOO Power Infrastructure Cement 60.72% Jaiprakash Power Ventures Ltd (JPVL) Jaypee Infratech Limited Cement JVs 300 MW Baspa – II HEP # (JIL) # 74% (4.3 MTPA) 165 Km long expressway 400 MW Vishnuprayag HEP # 83.1% with 530 mn sq ft Real 1,000 MW Karcham Wangtoo HEP # Jaypee Cement Estate Development 1200 MW Bina TPP (500 MW) # 100% Corporation Limited (Yamuna Expressway) 1,320 MW Nigrie TPP (UI)* (9.8 MTPA) Himalayan Expressway Coal Mining Limited # Prayagraj Power Generation Co. Ltd. 100% 88.5% (Cement) 3300MW Bara TPP – 1980MW (UI) (1)* (NHAI BOOT Project) Mandla (N) - JAL Mandla (S) – JV of Jaypee Sports Int’l JAL & MPSMCL Jaypee Powergrid Limited 90.5% Limited 74% 214 KM Long Transmission System Coal Mining (Power) (Formula-1) # JVs of JAL & MPSMCL 3 SPVs for executing an aggregate capacity of (For Nigrie Thermal) Jaypee Fertilizers & Industries 100% 5900 MW Limited (JFIL) * ( Fertilizer Plant at Kanpur) (1) JAL has a right to subscribe up to 26% Equity in this Project * UI - Under Implementation # In Operation Market Cap. ( 30 th Apr’13) – JAL INR 166.99 Bn ( USD 3.34 Bn) ; JPVL INR 75.07 Bn (USD 1.50 Bn) ; JIL INR 51.81 Bn ( USD 1.04 Bn) 5

  6. Demonstrated Execution Capability JAL is the leader in the construction of multi-purpose river valley and hydropower projects and has been involved in construction of major engineering projects over the last 4 decades Baghalihar I ** Karcham Wangtoo Proud To Participate In 450MW 1000 MW  Largest Concrete Dulhasti Nathpa Jhakri 390 MW 1,500 MW Dam In India – Sardar Vishnuprayag* Sarovar Teesta 400 MW Baspa-II* 510 MW 300 MW Tehri 1,000 MW  Largest Rockfill Dam Chamera II** 300 MW In India – Tehri BHUTAN  Largest Underground Sardar Sarovar Powerhouse In India – 1,450 MW Nathpa-Jhakri Omkareshwar** Tala 520 MW  Second Largest 1,020 MW B A Y O F Indira Sagar Surface Powerhouse B E N G A L 1,000 MW In India – Indira-Sagar *BOO projects Projects completed between 2002-2011 **EPC contracts JAL has participated in projects that have added 9840 MW to the national grid between 2002 and 2011 6

  7. 2 Section Company Overview 7

  8. Jaypee Infratech – Unique Balance of Toll & Real Estate Unique Infrastructure company with balance of Toll & Real Estate revenues Jaiprakash Associates Ltd. 83.1% Jaypee Infratech Limited Real Estate Development Expressway along Yamuna Expressway # Development of Noida (NCR) – 1,235 Acres * Expressway On BOOT Basis (165 km Yamuna Jaganpur (NCR) – 1,235 Acres Expressway) Mirzapur (NCR) – 1,235 Acres Tappal – 1,235 Acres Agra – 1,235 Acres Listed companies * JIL has sold/ sub-leased 367 acres of the Noida land and plans to develop the remaining 868 acres 8 # As of Mar 31, 2013, JIL had signed lease deeds and taken possession of approximately 6,072 acres (98.3%) for Real Estate Development

  9. Amongst the Largest Land Banks in Nat. Capital Region PROPOSED JAYPEE GREENS MIRZAPUR JAYPEE GREENS SDZ NIGHT - DIST. GAUTAM BUDH G.NOIDA (182 Ha) Ch 52 km Ch 50 km SAFARI NAGAR Ch 40 km Ch 45 km Ch 20 km Ch 15 km Ch 25 km Ch 30 km Ch 10 km (500 Ha) 5 115 km Ch 5km 3 ZERO POINT (0 KM) Ch 35 km M 4 6 km 2 JAYPEE GREENS JAYPEE SPORTS INT’L JAYPEE GREENS AGRA TAPPAL - DIST. GAUTAM BUDH PROPOSED DISTANCE: 14 km (500 Ha) (500 Ha) NAGAR METRO LINK JAYPEE GREENS (1000 Ha) JAGANPUR - DIST. GAUTAM BUDH NAGAR JAYPEE NOIDA-GREATER NOIDA EXPRESSWAY (500 Ha) GREENS - 165 km 6 LANE YAMUNA AMAN EXPRESSWAY M PROPOSED EASTERN PERIPHERAL EXPRESSWAY NCR PROPOSED BOUNDARY METRO LINK 1 JAYPEE GREENS NOIDA LAND PARCEL (500 Ha) NOIDA New Delhi MAP NOT TO SCALE Real Estate under development 9

  10. 3 Section Yamuna Expressway Project 10

  11. Project Expenditure & Funding Project Expenditure All figures in Rs. Crs Incurred till Mar 2013 Description Total Project Cost 13,300 13,152 Funding All figures in Rs. Crs Description Total Incurred till Mar 2013 Equity from Promoters and Others 1,250 1,250 IPO proceeds 1,500 1,500 Accruals from real estate development incl. 3,550 3,596 advances & sales of land Debt 7,000 6,657 ** Total 13,300 13,152 11 # IPO of Jaypee Infratech Ltd. successfully completed in May 2010. Total proceeds raised by Jaypee Infratech Ltd. – Rs. 1,650 Crs ; ** Includes Rs 149 Cr of outstanding liabilities.

  12. Toll revenues Toll Rate for G Noida-Agra Total Concession Period: 36 Years (Single Journey) Toll Rates. Rs. Average Annual Total Revenue Financial Year Daily Traffic Two Wheeler 150 (` in Crores) (PCUs) Car/Jeep 320 LCV 500 FY’13 9,611 58.77 Truck/Bus 1050 (Aug’12 –Mar’13) MAV 1600 Revenue Annual Avg. Daily Traffic 400 70,000 (Rs. In Crores) 350 60,000 300 50,000 250 40,000 200 353 30,000 150 20,000 100 200 150 10,000 50 - - FY 14 (E) FY 15 (E) FY 16 (E) 12

  13. 4 Section Real Estate Development 13

  14. Land Acquisition completed for all 5 land parcels Saleable Land Leased Remaining Land Locations Area Area (Mn as at Mar as of Mar 2013 (Acres) Sq Ft) 2013 (Acres) (Acres) Located 1,235 1. Noida 78 1,232* 3 In NCR District Gautam 2. Budh Nagar 1,235 116 1,212 23 (parcel 2) District Gautam 3. Budh Nagar 1,235 116 1,188 47 (parcel 3) 4. District Aligarh 1,235 116 1,225 10 5. District Agra 1,235 103 1,215 20 TOTAL 6,175 530 6,072 103 Out of Total 530 Mn Sq Ft developable area, 311 Mn Sq Ft is in NCR alone 14 * Includes 359.56 acres that was sold as undeveloped land and 8.20 acres that was sub-leased.

  15. Infrastructure Initiatives in the Region driving Demand Distance from Jaypee Greens Development Location NOIDA In KM (Appx.) Noida – Greater Yamuna Expressway 15 Noida Commissioned Formula 1 Greater Noida 30 First Race held in 2011 Jaypee Greens Championship Golf Operational Greater Noida 17 Course (5 Star Resort & Six Senses Spa) Noida – Greater Planned Metro Rail Link 5 Approved Noida Noida – Greater Planned Bodaki Railway Station and 28 Transport Hub Noida Planned Night Safari Greater Noida 25 Proposed Amusement Park Greater Noida 18 Proposed International Airport TBD 15 15

  16. Real Estate Performance Area Sold Average Net Rate Net Sales Value Advances Received PERIOD (Mn Sq Ft) (Rs / Sq Ft) ( Rs Mn) (Rs Mn) 2008-09 0.95 3,328 3,162 630 (Dec. ’08 – Mar’09) 2009-10 20.35 2,858 16,699 58,165 (Apr. ’09 – Mar’10) 2010-11 12.38 3,308 40,953 31,455 (Apr. ’10 – Mar’11) 2011-12 Noida 10.24 4,170 42,704 29,073 2011-12 Mirzapur 0.68 4,038 2,746 305 Subtotal (2011-12) 10.92 4,162 45,450 29,378 2012-13 Noida 6.80 4,381 29,792 34,761 2012-13 Mirzapur 1.30 2,236 2,907 1,103 Subtotal (2012-13) 8.10 4,037 32,699 35,864 TOTAL 52.70 3,423 180,429 114,026 16

  17. Real Estate Performance: Noida Sales Value (in Mn) Average Realization (Rs / Sq Ft) 70,000 5,000 4,381 4,500 4,170 60,000 4,000 50,000 3,328 3,308 3,500 2,858 3,000 40,000 2,500 30,000 58,165 2,000 42,704 1,500 40,953 20,000 29,792 1,000 10,000 500 3,162 Rs / Sq Ft Rs Mn - - 08-09 09-10 10-11 11-12 12-13 17 Note: Sales Value & Average Rate for Noida

  18. Indicative Sales Value / Valuation for Parcel 2, 3 & 5 Parcel 2 Parcel 3 Parcel 5 Total Area 1235 1235 1235 3705 (in Acres) Saleable Area 116 116 103 335 (in Mn Sq Ft) Average Selling INR INR INR INR Price 4000 3000~3500 2750~3000 2900~3300 (per Sq Ft) Potential Sale 54000 35000~40000 28000~30000 98000~110000 Value (INR Cr) Valuation of Land Parcel 16000 10000~12000 8500~9000 34500~37000 (assuming 30% EBITDA margin) (INR Cr) Source: JIL – Company Current Prices 18

  19. Real Estate Delivery Schedule: Noida Delivery (in Mn Sq Ft) 16 14.8 14 12 12.1 11.4 10 8.9 8 6 4 3.7 2.2 2 0 Delivered FY 14 FY 15 FY 16 FY 17 FY 18 19

  20. 5 Section Financial Overview

Download Presentation
Download Policy: The content available on the website is offered to you 'AS IS' for your personal information and use only. It cannot be commercialized, licensed, or distributed on other websites without prior consent from the author. To download a presentation, simply click this link. If you encounter any difficulties during the download process, it's possible that the publisher has removed the file from their server.

Recommend


More recommend