
SLIDE 1
1
UNAUDITED GROUP RESULTS
for the six months ended 31 December 2014
2
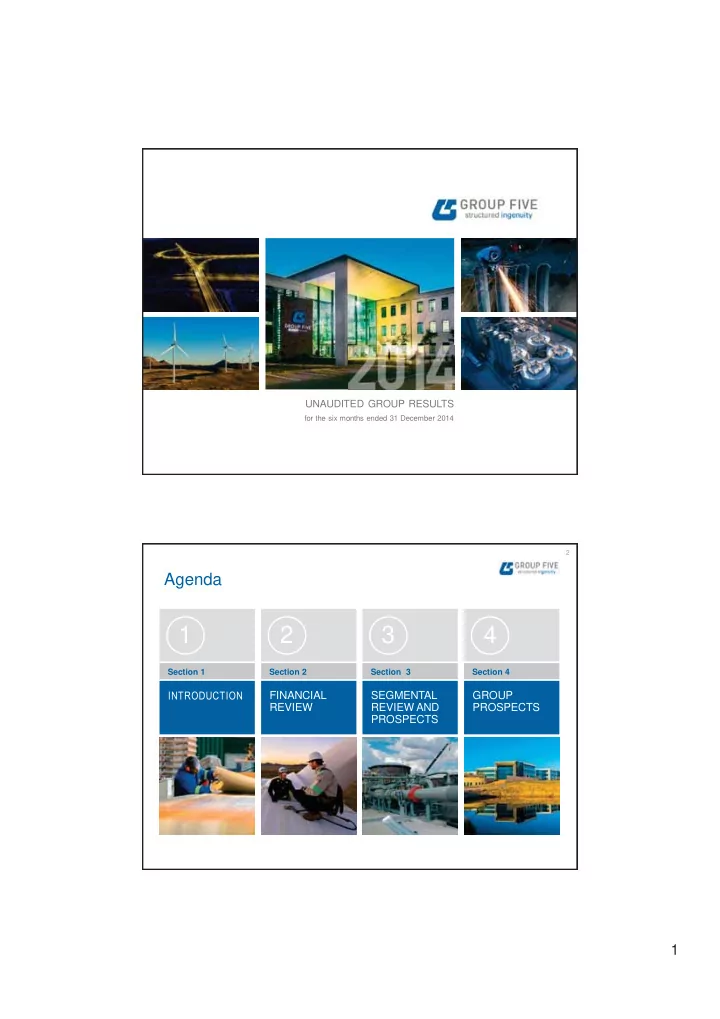
Agenda
INTRODUCTION
Section 1
FINANCIAL REVIEW
Section 2
SEGMENTAL REVIEW AND PROSPECTS
Section 3
GROUP PROSPECTS
Section 4
1 2 3 4 Section 1 Section 2 Section 3 Section 4 INTRODUCTION - - PDF document
UNAUDITED GROUP RESULTS for the six months ended 31 December 2014 2 Agenda 1 2 3 4 Section 1 Section 2 Section 3 Section 4 INTRODUCTION FINANCIAL SEGMENTAL GROUP REVIEW REVIEW AND PROSPECTS PROSPECTS 1 3 INTRODUCTION
for the six months ended 31 December 2014
2
Section 1
Section 2
Section 3
Section 4
3
4
Headline earnings: H1 F2015 earnings adjusted for profit on fair value adjustment of an investment property
INTRODUCTION
* excluding Construction Materials reflected as a discontinued operation
5
INTRODUCTION
6
INTRODUCTION
7
Chairperson
CEO
CFO
Non-exec
Non-exec
Non-exec, DRC
Non-exec
Non-exec
Non-exec
Non-exec, Kenyan
Non-exec, Zambian
~ new appointment, since 1 Dec 2014, internal placement ^ previously MD of Projects, a high performing BU * previously commercial director at Buildings, appointment effective 1 Feb 2015 ** previously contracts director at Projects, appointment effective 1 Feb 2015 Engineering & Engineering & Construction Investments and Concessions Manufacturing Head of Africa Risk CFO HR
INTRODUCTION
Building Building and Housing Civil Engineering Projects
Operations Director: M. Humphreys ^ ~ Energy
CEO: E. Vemer ~
8
9
including fair value adjustments
FINANCIAL REVIEW
* excluding Construction Materials reflected as a discontinued operation
10
FINANCIAL REVIEW
* Core margin is total margin adjusted for non-core transactions of pension fund gains/deficits, but not adjusted for profit /loss on sale of assets ~ target as guided in Nov 2014 ** in line with guidance in Nov 2014
11
FINANCIAL REVIEW
12
13
FINANCIAL REVIEW
14
FINANCIAL REVIEW
15
FINANCIAL REVIEW
16
long term
long term
FINANCIAL REVIEW
17
18
19
48 43 46 32 34 (44) 75 45 56 49 45 12
2 230 2 200 2 343 2 052 1 708 1 626 1 020 721 931 1 589 1 932 1 048
65%
32%
SEGMENTAL REVIEW Engineering & Construction
* H1 F2015 versus H1 F2014
20
1 4 7 10 H1 F14 H2 F14 H1 F15
H1 F14 H2 F14 H1 F15
H1 F14 H2 F14 H1 F15
H1 F14 H2 F14 H1 F15 Below range* 3 – 5%
Within range* 2 – 4%
Within range* 5 – 8%
Below range* 3 – 5%
* Cluster target margin range
SEGMENTAL REVIEW Engineering & Construction
21
SEGMENTAL REVIEW Engineering & Construction
* Structural, Mechanical, Electrical, Instrumentation and Piping
22
SEGMENTAL REVIEW Engineering & Construction
^ Front End Engineering and Design * Renewable Energy Independent Power Producer Programme ** Group Five share of revenue
23
SEGMENTAL REVIEW Engineering & Construction
^ Front End Engineering and Design
24
SEGMENTAL REVIEW Engineering & Construction
25
* Structural, Mechanical, Electrical, Instrumentation and Piping
SEGMENTAL REVIEW Engineering & Construction
26
* O+M = Operations and Maintenance Services (refer O+M order book) ** O+M specific to industrial, oil and gas and power, excludes I&C O+M of R4,4bn
^ Renewable Energy Independent Power Producer Programme ^^ Liquid Natural Gas
SEGMENTAL REVIEW Engineering & Construction
~ Front End Engineering and Design
27
Kpone
Client: Cenpower Generation IPP
Design, procure and build 350MW combined cycle power plant 3-year contract Lenders Led by RMB Credit Insurer ECIC* Shareholders Cenpower Holdings African Finance Corporation (AFC) African Infrastructure Investment Managers (AIIM) Sumitomo Corporation FMO Entrepreneurial Bank Foreign equipment supply 50% of project value
** Group Five share of contract value * Export Credit Insurance Corporation
28
29
10 15 20 25 30 H1 F14 H2 F14 H1 F15
* H1 F2015 versus H1 F2014
^ FVA = Fair Value Adjustments - Refer Note 12 F2014 AFS for detail of basis of valuation
48%
SEGMENTAL REVIEW Investments and Concessions
30
* O+M = Operations and Maintenance Services; (refer O+M* order book) ** O+M specific to transport concessions, excludes E+C O+M of R253m
SEGMENTAL REVIEW Investments and Concessions
31
SEGMENTAL REVIEW Investments and Concessions
* Represents movement during H1 F2015
32
33
6 12 H1 F14 H2 F14 H1 F15
* H1 F2015 versus H1 F2014
20%
SEGMENTAL REVIEW Manufacturing
34
SEGMENTAL REVIEW Manufacturing
35 35
36
* Total secured order book is: valuation to first review date of secured contracts only valued using real cash flows (excluding escalation clauses)
GROUP PROSPECTS Order Books
37
Public over-border 1%
42%
88% 86%
Public local 28% 42% 39% 2% 5% Private local 29% 58% 10% 10% 9%
* Values include only Group Five’s portion of fully secured construction work
GROUP PROSPECTS Order Books
38
Public over-border 1%
42%
88% 86%
Public local 28% 42% 39% 2% 5% Private local 29% 58% 10% 10% 9%
* Values include only Group Five’s portion of fully secured construction work ** Previously called Engineering & Construction
GROUP PROSPECTS Order Books
39
* Total order book comprises secured Contracting and O+M order books Refer Appendix 1 for graphical representation of Contracting order book
GROUP PROSPECTS Order Books
7% 1% 12% 7% 9% 31% 33%
R17,150 bn R17,150 bn
2% 1%1% 64% 14% 18%
R17,150 bn
40
^ Value within the multi-year opportunity pipeline in pre-tender and tender stage
GROUP PROSPECTS Order Books
* These are the projects targeted by the group – not to be confused with the Engineering & Construction contracting order book
41
42
* Source – Nedbank Economic Research
GROUP PROSPECTS Group Outlook
43
GROUP PROSPECTS Group Outlook
* Annualised
44
45
This presentation which sets out the interim results for Group Five Limited for the period ended 31 December 2014 contains ‘forward- looking statements’, which have not been reviewed or reported on by the Group’s auditors, with respect to the Group’s financial condition, results of operations and businesses and certain of the Group’s plans and objectives. In particular, such forward looking statements include statements relating to, amongst others, the Group’s future performance; future capital expenditures, acquisitions, divestitures, expenses, revenues, financial conditions, dividend policy, and future prospects; business and management strategies relating to the expansion and growth of the Group; the effects of regulation of the Group’s businesses by governments in the countries in which it operates; expectations regarding the operating environment and market conditions. Forward-looking statements are sometimes, but not always, identified by their use of a date in the future or such words as ‘will’, ‘anticipates’, ‘aims’, ‘could’, ‘may’, ‘should’, ‘expects’, ‘believes’, ‘intends’, ‘plans’ or ‘targets’. By their nature, forward-looking statements are inherently predictive, speculative and involve risk and uncertainty because they relate to events and depend on circumstances that will occur in the future, involve known and unknown risks, uncertainties and other facts or factors which may cause the actual results, performance or achievements of the Group, or its industry to be materially different from any results, performance or achievement expressed or implied by such forward-looking statements. Forward-looking statements are not guarantees of future performance and are based on assumptions regarding the Group’s present and future business strategies and the environments in which it operates now and in the future. Undue reliance should not be placed on such statements and opinions because by nature, they are subjective to known and unknown risk and uncertainties and can be affected by
forward looking statements. Neither the Group nor any of its respective affiliates, advisors or representatives shall have any liability whatsoever (based on negligence or otherwise) for any loss howsoever arising from any use of this presentation or its contents or
looking statements whether to reflect new information or future events or circumstances otherwise.
Our website: www.groupfive.co.za a
46
47
Appendix 1
48
* Total project value, Group Five and other consortium members ** Southern and East Africa
Appendix 2