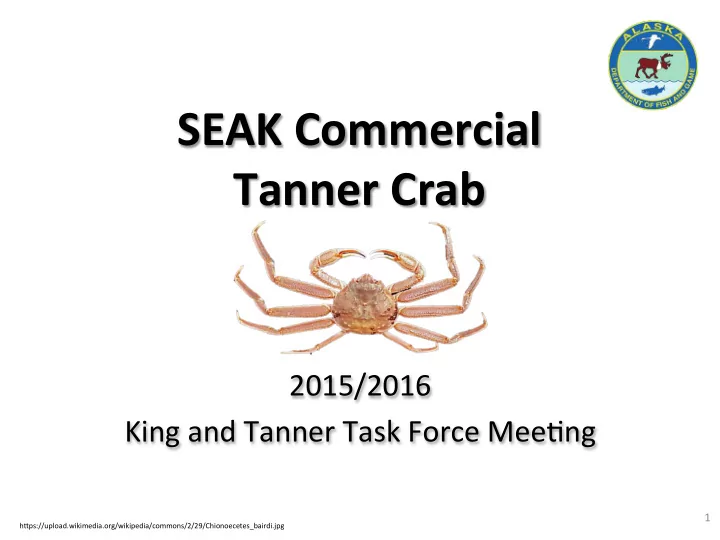

SEAK Commercial Tanner Crab 2015/2016 King and Tanner Task Force Mee7ng King and Tanner Task Force Meeting – 01/29/16 1 h9ps://upload.wikimedia.org/wikipedia/commons/2/29/Chionoecetes_bairdi.jpg
2014/2015 Commercial Tanner Season Summary • Landed Poundage: 1,421,863 lb • Number of Crab: 550,545 • Total Permits with Landings: 63 Pot/20 Ring • Core Poundage: 82% of Total Harvest • Non-Core Poundage: 18% of Total Harvest • Average CPUE – Pot : 18.1 • Average CPUE – Ring: 1.9 • Average $/LB – $1.93 2
Commercial Tanner Season Summary 2013/14 and 2014/15 Last two seasons’ harvest by district: District 2013/14 2014/15 5 * * 6 48,521 19,863 7 * 2,714 8 52,811 48,346 9 13,824 * 10 130,748 132,680 11 605,763 748,332 12 53,045 22,747 13 13,350 37,628 14 259,301 209,969 15 78,496 194,346 Total 1,256,739 1,421,863 *Confiden7al data: Less than 3 Permit Holders 3
4
2012/2013 2013/2014 2014/2015 District % BCD % BCD % BCD 5 - 0 - 6 0.4 0.2 0.3 7 0.1 0.4 0.2 8 20.4 6.6 9.3 9 0.1 0.3 0.0 10 7.2 2.9 2.8 11 9.5 8.7 14.2 12 0.0 0.7 1.4 13 0 0 0 14 0.0 2.2 0.9 15 18.4 30.1 42.7 % for All Areas Combined: 6.9 7.2 14.1 % BiVer Crab Per District 50.0 2012/2013 % BCS 40.0 2013/2014 % BCS 30.0 2014/2015 % BCS 20.0 10.0 0.0 5 6 7 8 9 10 11 12 13 14 15 Districts 5
6
Es7mated SEAK Mature Tanner Crab Biomass: 2014/2015 EsWmate: 5.48 Million Lb 2015/2016 EsWmate: 5.69 Million Lb 7
Tanner Crab Harvest Strategy 5 AAC. 35.113 8
9
• 2015 Changes to Survey: o Port Camden and Port Frederick removed from survey. o Stephens Passage was removed from Tanner crab survey, but is s7ll part of red king crab survey. • Overall: There was a 0.34 million pound increase in legal male Tanner crab ( ~12% increase ) from 2014. 10
• Tanner Crab Survey Areas: Icy Strait Glacier Bay Thomas Bay Holkham Bay • Red King Crab Survey Areas: Stephens Passage Seymour Canal North Juneau Excursion Inlet Pybus Bay Gambier Bay Peril Strait Lynn Sisters 11
ICY STRAIT • Stock Health Status: Poor • All male recruit class CPUEs down. • Mature female CPUE down. • % Females with poor clutch fullness below 10% level. • Legal biomass es7mate in 2015 lowest since incep7on of the crab surveys. 12
GLACIER BAY • Stock Health Status: Above Average • No short-term ( S-T ) increasing trends in CPUE. • All recruit class CPUE at long-term ( L-T ) average. • % females with poor clutch fullness was below 10% threshold. 13
THOMAS BAY • Stock Health Status: Moderate • Male recruit class CPUEs are at or above L-T averages. • Prerecruits and recruits have S-T increasing trends. • Mature female CPUE below L-T average. • % of females with poor clutch fullness is not significantly different from 10%. 14
HOLKHAM BAY • Stock Health Status: Healthy • No significant S-T trends in either direc7on in all recruit class CPUEs. • All male recruit class CPUEs are above L-T averages. • Mature female CPUEs remain stable. • % of females with poor clutch fullness was low and falling below L-T average of 10% 15
STEPHENS PASSAGE • Stock Health Status: Healthy • Increasing S-T trends in recruit CPUE and all recruit class CPUEs are at or above L-T averages. • Prerecruits and recruits have S-T increasing trends. • % of females with poor clutch fullness is less than 10% threshold. 16
SEYMOUR CANAL • Stock Health Status: Healthy • All CPUEs were at or above their L-T averages. • Increasing S-T trends seen in both mature female and pre-recruit CPUE. • Increasing trends in pre-recruits and mature male CPUEs for L-T averages. • % of females with poor clutch fullness is well below 10% long-term average threshold. 17
NORTH JUNEAU • Stock Health Status: Above Average • Decreases in mature male CPUEs • All CPUEs at or above L-T averages, but decreases could indicate decreasing stock health. • % of females with poor clutch fullness is less than 10% long-term average threshold. 18
EXCURSION INLET • Stock Health Status: Above Average • Recruit CPUEs S-T trend increasing. • Pre-recruit and post-recruit CPUEs above L-T averages. • Post-recruit and mature female CPUEs have decreasing S-T trends. • % of females with poor clutch fullness is less than 10%. 19
PYBUS BAY • Stock Health Status: Healthy • All recruit class CPUEs above L-T averages. • Increasing S-T trends in pre-recruit, recruit, and mature female CPUEs • % of females with poor clutch fullness was less than 10%. 20
GAMBIER BAY • Stock Health Status: Above Average • CPUEs of pre-and post-recruits at or above L-T averages. • Increasing S-T trends in pre-recruit, recruit, and mature female CPUEs. • Recruit CPUE is below L-T average. • % of females with poor clutch fullness was less than 10%. 21
PERIL STRAIT • Stock Health Status: Moderate • All male recruit class CPUEs are at L-T averages, but decreased. • No short term trends in CPUEs. • Recruit CPUE is below L-T average. • % of females with poor clutch fullness was less than 10%. 22
LYNN SISTERS • Stock Health Status: Healthy • CPUEs of pre-recruits and recruits above L-T averages. • Post-recruit and mature female CPUEs at L-T averages. • % of females with poor clutch fullness was less than 10%. 23
Photo by Ryan Li9leton. 24
Recommend
More recommend