scaling nmds
play

Scaling (NMDS) Objective: Group data points into classes of similar - PowerPoint PPT Presentation

Multivariate Fundamentals: Distance Non-metric Multidimensional Scaling (NMDS) Objective: Group data points into classes of similar points based on a series of variables Lots of types of multidimensional scaling: PCA is aka Classic


  1. Multivariate Fundamentals: Distance Non-metric Multidimensional Scaling (NMDS)

  2. Objective: Group data points into classes of similar points based on a series of variables Lots of types of multidimensional scaling: PCA is aka Classic Multidimensional Scaling The goal of NMDS is to represent the original position of data in multidimensional space as accurately as possible using a reduced number of dimensions that can be easily plotted and visualized (like PCA). BUT (unlike PCA which uses Euclidian distances) NMDS relies on rank orders (distances) for ordination (i.e non-metric) The use of distances omits some of the issues associated with using predictor variables alone (e.g., sensitivity to transformation) Allows for much more flexible technique that accepts a variety of data types Shepard 1962 Kruskal 1964 Contributed to the development of multidimensional scaling Tprgersen & Meuser 1962 Guttman 1968

  3. The math behind NMDS NMDS is an iterative procedure which takes place over several steps: 1. Define the original data point positions in multidimensional space 2. Specify the number of reduced dimensions you want (typically 2) 3. Construct an initial configuration of the data in 2-dimensions 4. Compare distances in this initial 2D configuration against the calculated distances 5. Determine the stress on data points 6. Correct the position of the points in 2D to optimize the stress for all points

  4. The math behind NMDS Consider a 3 variable analysis with 4 data points Euclidian Plot in 2D by distance Variable 2 (could be any distance matrix) A B C D D 2.6 A 0 1.6 2.6 2.4 A C B 1.6 0 2.5 3.3 Variable 3 C 2.6 2.5 0 1.7 1.6 2.6 D 2.4 3.3 1.7 0 C A B 3.3 D B Variable 1 When we compress our 3D image to 2D we cannot Data.ID Varable1 Variable2 Variable3 accurately plot the true distances A 0.9 1.9 1.5 E.g. the distances between AD and BC are too big in the image B 1.7 0.5 1.6 The difference between the data point position in 2D (or # C 3 2 3.1 of dimensions we consider with NMDS) and the distance D 1.9 3.5 3 calculations (based on multivariate) is the STRESS we are trying to optimize

  5. NMDS optimizing stress Stress – value representing the difference between distance in the reduced dimension compared to the complete multidimensional space NMDS tries to optimize the stress as much as possible Think of optimizing stress as: “ Pulling on all points a little bit so no single point is completely wrong, all points are a little off compared to distances ” Ideally we want as little stress as possible

  6. NMDS in R To run NMDS you need to install the ecodist package NMDS in R: library(ecodist) nmds(distMatrix,mindim=n,maxdim=n) (ecodist package) mindim = minimum number of dimensions you want to use Distance matrix of your data maxdim = maximum number of dimension rows based on your predictor you want to use variables You can run NMDS with as many dimensions You need to calculate this as you have predictor variables, BUT we are before running the NMDS trying to reduce the dimensions so we can analysis group data points Typically we want to set both of these values to 2 to simplify our output

  7. NMDS in R Distance matrix Mahalanobis is good for correlated variables Scores – these are the data point outputs that have be pulled to optimize the stress from multi dimensions in 2D (or the # of dimensions considered) These are the values we plot to look at which data points group together We can merge a class variable back into look if pre- determined groups actually group out together or see what groups we could potentially combine

  8. NMDS in R Stress – value representing the difference between distance in the reduced dimension compared to the complete multidimensional space R will produce a list of values – one for each iteration it had to do – the more complex your dataset the more iterations (and time to run the analysis) are needed The last value in the list is the final stress value which is uninformative by itself, but you should check to make sure the stress is stable when you consider more dimensions (modify maxdim)

  9. NMDS in R Your data may NOT be able to be viewed in 2D due to high stress Use the rationale: “Include dimensions until I don’t gain a significant reduction in my stress value” If stress is too high for 2D or 3D NMDS might not be the best method i.e. Visualizing your data in fewer dimensions compromises the data too much

  10. NMDS - Biplot 
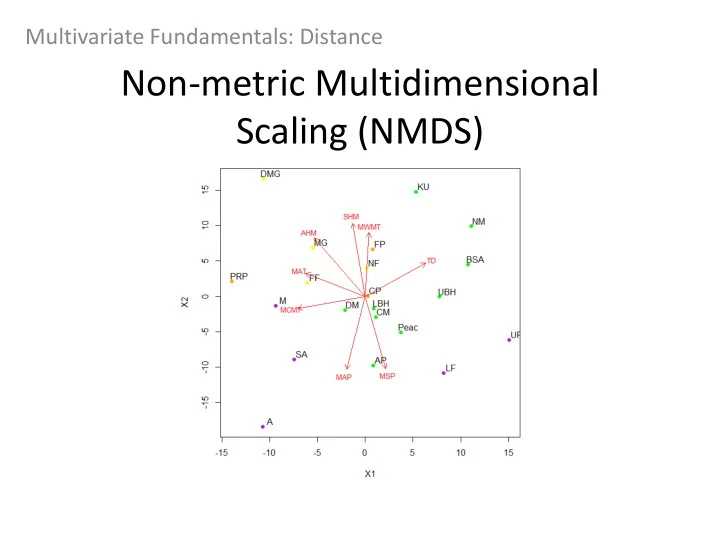
Data points considering scores in 2D Direction of the arrows +/- indicate the trend of points (towards the arrow indicates more of the variable) The closeness of points will indicate how similar they are It is up to you to determine where groupings should be made

  11. NMDS - Biplot Once you decide on groups you can then use graphics to simply distinguish them We cover this in Lab 5

Download Presentation
Download Policy: The content available on the website is offered to you 'AS IS' for your personal information and use only. It cannot be commercialized, licensed, or distributed on other websites without prior consent from the author. To download a presentation, simply click this link. If you encounter any difficulties during the download process, it's possible that the publisher has removed the file from their server.

Recommend


More recommend