SLIDE 1 Sakhalin Taimen (Hucho perryi)
Additional documentation.
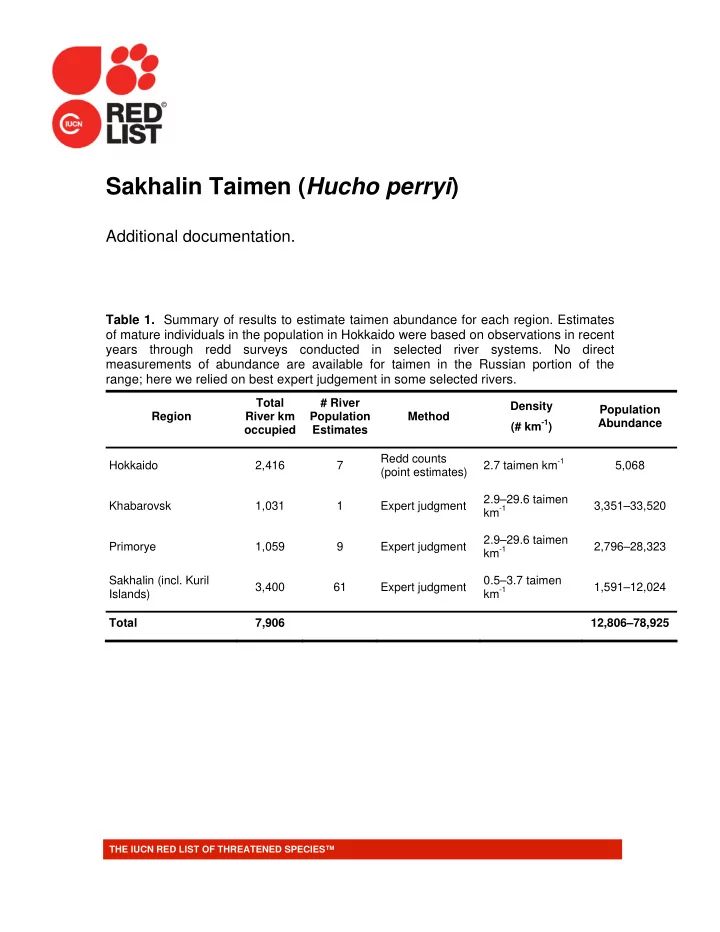
Table 1. Summary of results to estimate taimen abundance for each region. Estimates
- f mature individuals in the population in Hokkaido were based on observations in recent
years through redd surveys conducted in selected river systems. No direct measurements of abundance are available for taimen in the Russian portion of the range; here we relied on best expert judgement in some selected rivers.
Region Total River km
# River Population Estimates Method Density (# km-1) Population Abundance Hokkaido 2,416 7 Redd counts (point estimates) 2.7 taimen km-1 5,068 Khabarovsk 1,031 1 Expert judgment 2.9–29.6 taimen km-1 3,351–33,520 Primorye 1,059 9 Expert judgment 2.9–29.6 taimen km-1 2,796–28,323 Sakhalin (incl. Kuril Islands) 3,400 61 Expert judgment 0.5–3.7 taimen km-1 1,591–12,024 Total 7,906 12,806–78,925
THE IUCN RED LIST OF THREATENED SPECIES™
SLIDE 2
Figure 1. Historical range map for Sakhalin Taimen. 2
SLIDE 3
Figure 2. Size at age for Sakhalin taimen collected in three Russian rivers, and several rivers in eastern Hokkaido, Japan. Line represents best fit of a von Bertalanffy growth model. Parameters are provided in parentheses (Linf, K). 3
SLIDE 4 Figure 3. Bycatch time series data (in landed biomass) for Sakhalin Taimen in Khabarovsk region,
- Russia. Three separate exponential models were fit to the data, each representing a separate era in
the fishery (identifying by dark, open, and grey symbols). Loss rates to the regional taimen population are provided by era. 4
SLIDE 5
Figure 4. Bycatch time series data (in landed biomass, in 100 kg) for Sakhalin Taimen in northern Sakhalin Island. An exponential model was fit to the data. The rate of loss in the population was estimated at 11% yr-1. 5
SLIDE 6
Figure 5. Catch at age data (number of individuals, log transformed) for Sakhalin Taimen collected on the Koppi River, Russia during 2000-2003. Catch for ages 3-16 was fit to a regression model. Values for total mortality (Z), natural mortality (M), and fishing mortality (F) are provided. See text on species Detailed Results page for further description and assumptions of this analysis. 6