
SLIDE 1
- M. Hayman, J. P. Thayer,
- R. M. Hardesty, M. O'Neill, M. Shupe,
- R. Stillwell, C. Alvarez
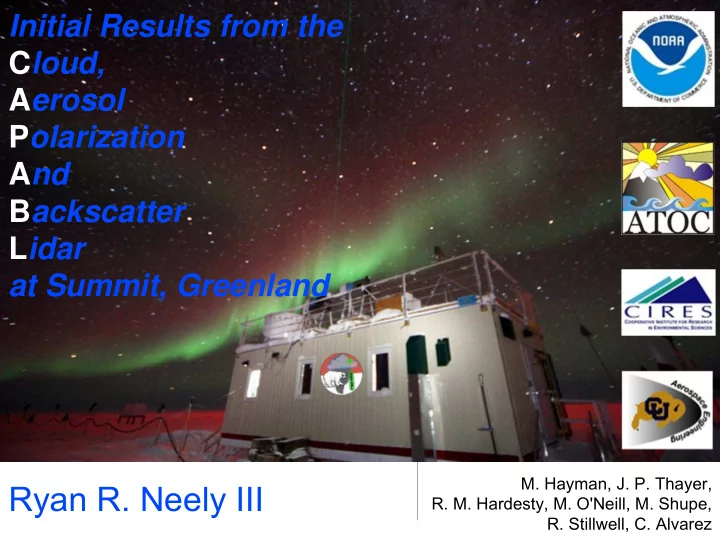
Initial Results from the Cloud, Aerosol Polarization And Backscatter Lidar at Summit, Greenland