
Roles of notes in co-located collaborative visualization
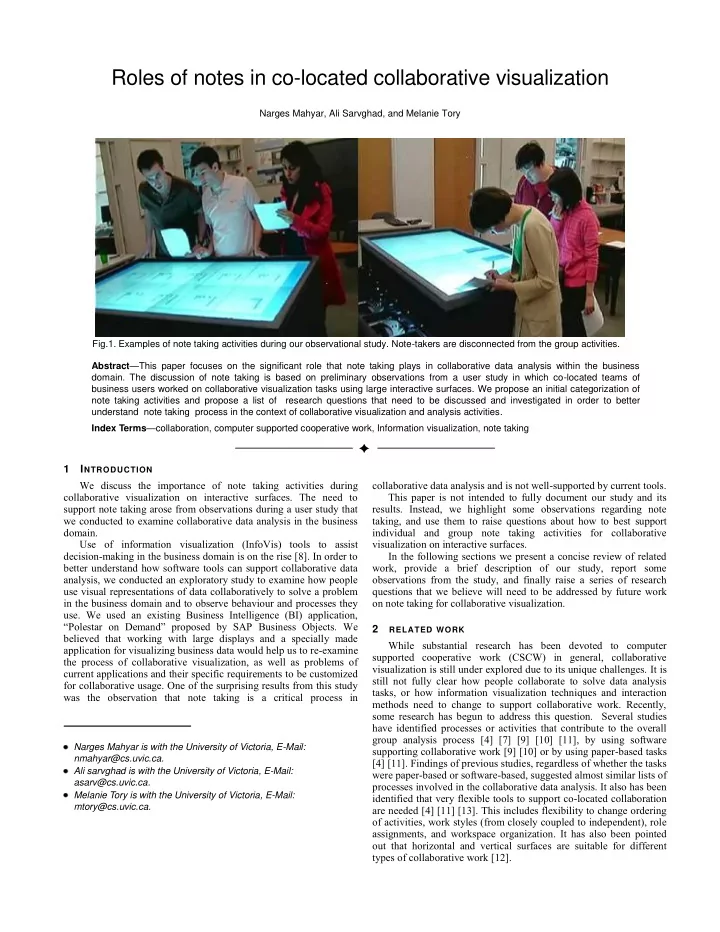
Narges Mahyar, Ali Sarvghad, and Melanie Tory Fig.1. Examples of note taking activities during our observational study. Note-takers are disconnected from the group activities. Abstract—This paper focuses on the significant role that note taking plays in collaborative data analysis within the business
- domain. The discussion of note taking is based on preliminary observations from a user study in which co-located teams of
business users worked on collaborative visualization tasks using large interactive surfaces. We propose an initial categorization of note taking activities and propose a list of research questions that need to be discussed and investigated in order to better understand note taking process in the context of collaborative visualization and analysis activities. Index Terms—collaboration, computer supported cooperative work, Information visualization, note taking
1 INTRODUCTION We discuss the importance of note taking activities during collaborative visualization on interactive surfaces. The need to support note taking arose from observations during a user study that we conducted to examine collaborative data analysis in the business domain. Use of information visualization (InfoVis) tools to assist decision-making in the business domain is on the rise [8]. In order to better understand how software tools can support collaborative data analysis, we conducted an exploratory study to examine how people use visual representations of data collaboratively to solve a problem in the business domain and to observe behaviour and processes they
- use. We used an existing Business Intelligence (BI) application,
“Polestar on Demand” proposed by SAP Business Objects. We believed that working with large displays and a specially made application for visualizing business data would help us to re-examine the process of collaborative visualization, as well as problems of current applications and their specific requirements to be customized for collaborative usage. One of the surprising results from this study was the observation that note taking is a critical process in collaborative data analysis and is not well-supported by current tools. This paper is not intended to fully document our study and its
- results. Instead, we highlight some observations regarding note
taking, and use them to raise questions about how to best support individual and group note taking activities for collaborative visualization on interactive surfaces. In the following sections we present a concise review of related work, provide a brief description of our study, report some
- bservations from the study, and finally raise a series of research
questions that we believe will need to be addressed by future work
- n note taking for collaborative visualization.
2
RELATED WORK
While substantial research has been devoted to computer supported cooperative work (CSCW) in general, collaborative visualization is still under explored due to its unique challenges. It is still not fully clear how people collaborate to solve data analysis tasks, or how information visualization techniques and interaction methods need to change to support collaborative work. Recently, some research has begun to address this question. Several studies have identified processes or activities that contribute to the overall group analysis process [4] [7] [9] [10] [11], by using software supporting collaborative work [9] [10] or by using paper-based tasks [4] [11]. Findings of previous studies, regardless of whether the tasks were paper-based or software-based, suggested almost similar lists of processes involved in the collaborative data analysis. It also has been identified that very flexible tools to support co-located collaboration are needed [4] [11] [13]. This includes flexibility to change ordering
- f activities, work styles (from closely coupled to independent), role
assignments, and workspace organization. It has also been pointed
- ut that horizontal and vertical surfaces are suitable for different
types of collaborative work [12]. Narges Mahyar is with the University of Victoria, E-Mail:
nmahyar@cs.uvic.ca.
Ali sarvghad is with the University of Victoria, E-Mail:
asarv@cs.uvic.ca.
Melanie Tory is with the University of Victoria, E-Mail:
mtory@cs.uvic.ca.