
SLIDE 1
Introduction to GIS 1
1
ISL 2004
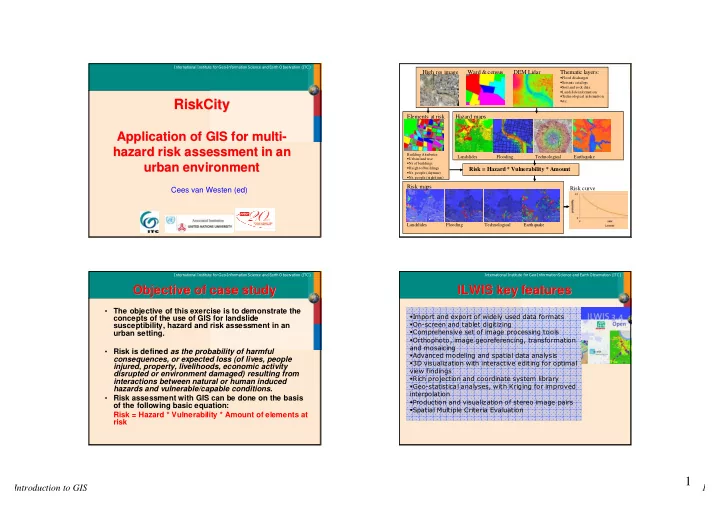
RiskCity RiskCity
Application of GIS for multi Application of GIS for multi-
- hazard risk assessment in an
hazard risk assessment in an urban environment urban environment
Cees van Westen (ed)
ISL 2004
Flowchart Flowchart
Elements at risk High res image DEM Lidar Ward & census Thematic layers:
- Flood discharges
- Seismic catalogs
- Soil and rock data
- Landslide information
- Technological information
- etc.
Risk curve
Building Attributes:
- Urban land use
- Nr of buildings
- Height of buildings
- Nr. people (daytime)
- Nr. people (nighttime)
Hazard maps Risk maps
Landslides Flooding Technological Earthquake Landslides Flooding Technological Earthquake
Risk = Hazard * Vulnerability * Amount
ISL 2004
Objective of case study Objective of case study
- The objective of this exercise is to demonstrate the
concepts of the use of GIS for landslide susceptibility, hazard and risk assessment in an urban setting.
- Risk is defined as the probability of harmful
consequences, or expected loss (of lives, people injured, property, livelihoods, economic activity disrupted or environment damaged) resulting from interactions between natural or human induced hazards and vulnerable/capable conditions.
- Risk assessment with GIS can be done on the basis
- f the following basic equation:
Risk = Hazard * Vulnerability * Amount of elements at risk
ISL 2004
ILWIS key features ILWIS key features
- !"
#$
- %
&'(