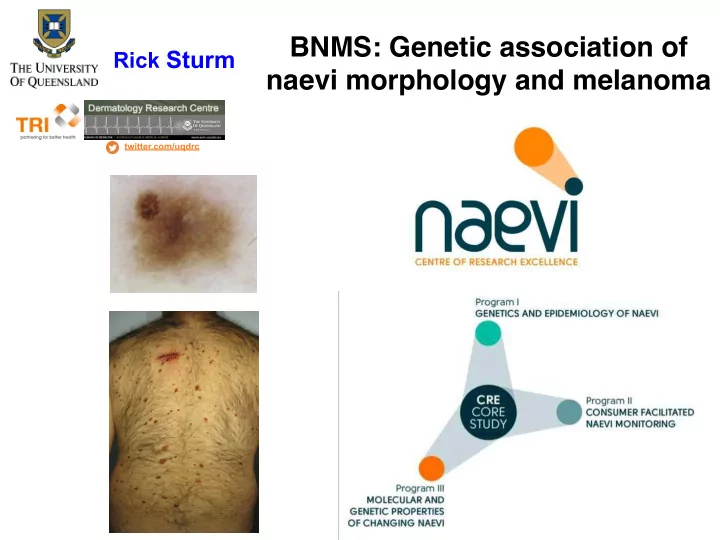

Rick Sturm BNMS: Genetic association of naevi morphology and melanoma twitter.com/uqdrc
Study Populations available to the CRE BERNS = Brisbane Electoral Roll Naevus Study, CRE core study n=150 BTNS = Brisbane Twin Naevus Study; n>3,000 (QIMR-B controls 23,724 individuals unaffected by CMM) BNMS = Brisbane Naevus Morphology Study, n=1,200 BMPMNS = Brisbane Multiple Primary Melanoma Naevus Study, n=100 BAMNS = Brisbane Advanced Melanoma Naevus Study n=80 BLTNS = Brisbane Lung Transplant Naevus Study n=90 Nambour trial = Trial of Sunscreen for Melanoma Prevention n= 1,626 MST = QSkin Melanoma Screening Trial n>60,000
What are naevi and how do they arise? Genotype Phenotype Environment
Effect of naevogenesis susceptibility genes and phenotypic correlation with dermoscopic characteristics of naevi H YPOTHESES : • MC1R variant alleles will have a major influence on innate melanocytic naevus morphology • Variation in other pigmentation genes such as TYR , which are modifiers of melanoma risk, may influence melanocytic naevus colour and morphology • Genes that have recently been recognised to influence naevus count including IRF4 , MTAP and PLA2G6 may also influence naevus morphology • Genes that regulate melanocytic cell function such as MITF will also act to modify naevus count and/or morphology
Brisbane Naevus Morphology Study (BNMS) 2011 to 2016 600 CMM cases or Family History AIM vs 600 control subjects N = 1200 Interim analysis of survey at 3 years 240 CMM cases + 76 Family History 256 control subjects Total Dec 2013 with phenotype + genotype N = 572 Recruited as of April 2016 N > 1100
Naevi classified by size, profile, colour and dermoscopic naevus pattern 13,587 melanocytic naevi >5mm Globular Reticular 15.6% 21.9% Homogeneous/ Nonspecific 62.5%
Total body naevus count by body-site and sex Female vs Male Nevi on Back/Backl+Legs 1.0 0.8 Proportion nevi back/(back+legs) 0.6 0.4 0.2 0.0 ● Female Male Female Male Sex
Collection of saliva for genetic analysis Assess pigmentation using Spectrophotometer Assess freckling density on face, hand & shoulders Documentation of patient demographics, sun exposure background, personal and family skin cancer / naevi history, medications Photographic documentation of eye colour
Phenotypic Characteristics of BNMS Freckling score vs Melanoma Naevus count vs Sex 200 ● Freckling Score 8 100 Naevi > 5mm 50 Count of nevi >5mm diameter 6 Freckling Score P*** 20 10 4 5 2 2 1 0 0 CMM FH+ Control Melanoma FH+ Control Male Female Male Female Melanoma Sex Skin Reflectance vs Sex Skin Reflectance vs Melanoma ● 70 70 ● Facultative Facultative 60 60 reflectance_fac reflectance_fac 50 50 ● ● 40 40 ● ● ● ● ● ● CMM FH+ Control Male Female Melanoma FH+ Control Male Female Hx sex
Naevus Count vs Melanoma Total Reticular 100 200 ● 100 50 ● ● Naevi > 5mm Naevi > 5mm ● 50 ● Count of Reticular Nevi >5mm ● 20 Count of Nevi >5mm ● ● ● ● 20 ● ● P*** ● ● ● 10 ● ● ● ● ● ● ● 10 ● ● ● 5 ● ● ● ● 5 2 2 1 1 0 ● 0 Melanoma FH+ Control CMM CMM FH+ Control FH+ Control Melanoma FH+ Control Melanoma Melanoma Globular Nonspecific 100 ● 100 ● 50 Naevi > 5mm 50 Naevi > 5mm Count of Globular Nevi >5mm 20 Count of NS Nevi >5mm 20 10 10 5 5 2 2 1 1 0 0 CMM Melanoma FH+ Control CMM FH+ Control FH+ Control Melanoma FH+ Control Melanoma Melanoma
Genotyping platforms Sanger Sequencing MC1R Genotyping Illumina Sequenom and Taqman CoreExome based SNP Genotyping 500,000 SNPs Whole Exome Sequencing (WES)
Candidate genes and SNPs associated with CMM in BNMS Rs/loc chr ps p-value -log10(p) gene name rs11570734 22 38.518622 0.0003 3.541 PLA2G6 mc1r 16 21.800000 0.0006 3.222 R,r,w rs4820314 22 38.518538 0.0007 3.175 PLA2G6 rs7023954 9 21.816758 0.0018 2.743 MTAP V56I mc1r_R163Q 16 89.986154 0.0036 2.449 MC1R R163Q rs7023329 9 21.816528 0.0048 2.319 MTAP CDKN2A carriers identified by Whole Exome Sequence (WES) Analysis
Recommend
More recommend