
SLIDE 1
SEPTEMBER 14, 2016 SEDIMENT ASSESSMENT OF CASCO BAY (1991-2011)
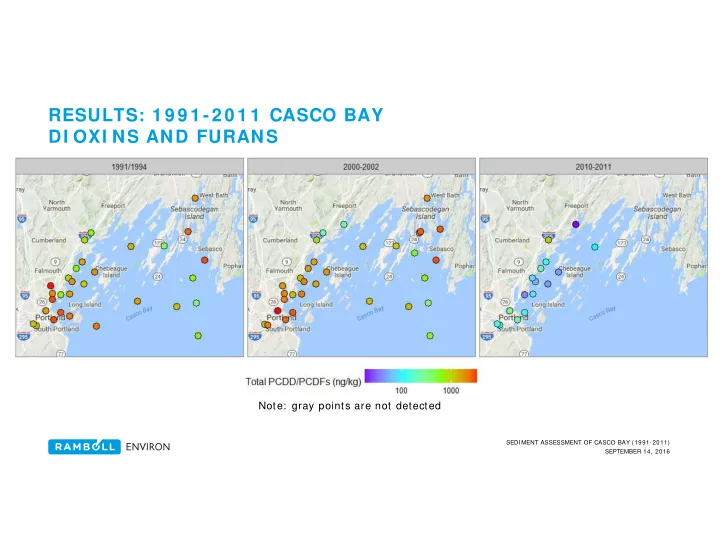
RESULTS: 1 9 9 1 -2 0 1 1 CASCO BAY DI OXI NS AND FURANS Note: - - PowerPoint PPT Presentation
RESULTS: 1 9 9 1 -2 0 1 1 CASCO BAY DI OXI NS AND FURANS Note: gray points are not detected SEDIMENT ASSESSMENT OF CASCO BAY (1991-2011) SEPTEMBER 14, 2016 RESULTS: 1 9 9 1 -2 0 1 1 CASCO BAY BUTYLTI NS Note: gray points are not detected
SEPTEMBER 14, 2016 SEDIMENT ASSESSMENT OF CASCO BAY (1991-2011)
SEPTEMBER 14, 2016 SEDIMENT ASSESSMENT OF CASCO BAY (1991-2011)
SEPTEMBER 14, 2016 SEDIMENT ASSESSMENT OF CASCO BAY (1991-2011)
SEPTEMBER 14, 2016 SEDIMENT ASSESSMENT OF CASCO BAY (1991-2011)
SEPTEMBER 14, 2016 SEDIMENT ASSESSMENT OF CASCO BAY (1991-2011)
SEPTEMBER 14, 2016 SEDIMENT ASSESSMENT OF CASCO BAY (1991-2011)
SEPTEMBER 14, 2016 SEDIMENT ASSESSMENT OF CASCO BAY (1991-2011)
SEPTEMBER 14, 2016 SEDIMENT ASSESSMENT OF CASCO BAY (1991-2011)
SEPTEMBER 14, 2016 SEDIMENT ASSESSMENT OF CASCO BAY (1991-2011)
10 100 1000 10000
Total PAHs (ng/g)
Casco Bay Gulf of Maine
Note: gray points are not detected
SEPTEMBER 14, 2016 SEDIMENT ASSESSMENT OF CASCO BAY (1991-2011)
SEPTEMBER 14, 2016 SEDIMENT ASSESSMENT OF CASCO BAY (1991-2011)
SEPTEMBER 14, 2016 SEDIMENT ASSESSMENT OF CASCO BAY (1991-2011)