
SLIDE 1
Responses of Microbial Communities to Increases in Nitrogen Loads in - - PDF document
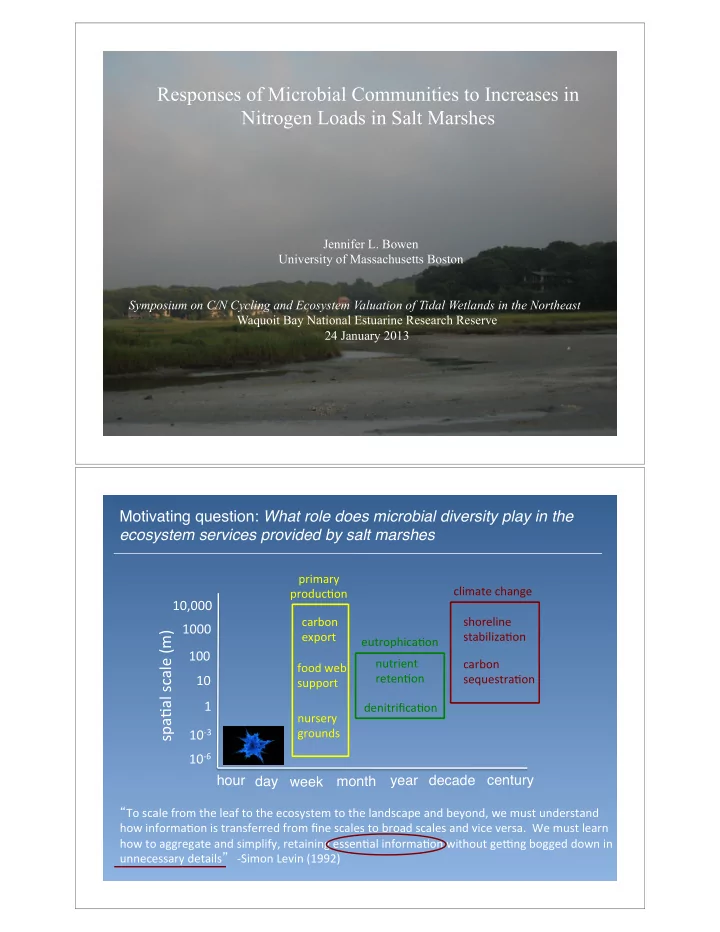
Responses of Microbial Communities to Increases in Nitrogen Loads in Salt Marshes Jennifer L. Bowen University of Massachusetts Boston ! Symposium on C/N Cycling and Ecosystem Valuation of Tidal Wetlands in the Northeast Waquoit Bay National
!Woese&1987& !Woese&1987&
no!change!in! composi+on!
temporarily!altered! composi+on!
return!to!ini+al!!state! permanently!altered! composi+on!
no!change!in!func+on!
Microbial! composi+on! !modified&from&Allison&and&Mar6ny&2008&
Modified&from&Philippot&et&al.&2007&
200 400 600 800 4000 8000 12000 marsh plot nirS
mp5 mp6 mp7 mp8 mp9 PA clone SHC2 clone SHCS clone SK clone
individual clone nirS
mp3 mp2 mp1
No matches within 80% similarity
0.1Marinobacter (>90%) S c a l i n d u a ( > 9 % ) D e c h l
a s ( > 8 5 % ) No matches within 80% similarity No matches within 80% similarity
Marsh sediments Estuarine sediments Eastern Tropical S. Pacific OMZ Arabian Sea OMZ
20000 40000 60000 500 1000 1500 Arabian Sea Chesapeake Bay ETSP
Number of OTUs Number of sequences
0.85 0.93 0.9 0.84 0.82 0.72 0.59 0.84 0.94 0.95 0.8 0.81 0.63 0.59 0.85 0.96 0.97 0.8 0.8 0.63 0.72 0.89 0.96 0.96 0.69 0.8 0.81 0.82 0.88 0.9 0.94 0.69 0.8 0.8 0.84 0.87 0.77 0.94 0.96 0.97 0.95 0.9 0.88 0.77 0.9 0.96 0.96 0.94 0.93 0.88 0.87 0.88 0.89 0.85 0.84 0.85
4 8 12
55
5_low
9
33
38
53
58 59
59
Additional thanks: Ivan Valiela, John Teal, Brian Howes, Dale Goehringer and many others at WHOI, MBL and SMAST for initiating and maintaining the Sippewisset. Additional assistance from D. Weisman, and M. Yasuda (UMB), S. Huse, L. Murphy, P. Neal, and C. Holmes (MBL), the lab groups of B. Ward and F. M.M. Morel (Princeton Universityt Fertilization plots as well as the Gifford and Hughes families for access to the plots.