RESPONSE BEHAVIOR OF RECTANGULAR CFRP TUBES DEVELOPED FOR FULL-LAP - - PDF document

response behavior of rectangular cfrp tubes developed for
SMART_READER_LITE
LIVE PREVIEW

RESPONSE BEHAVIOR OF RECTANGULAR CFRP TUBES DEVELOPED FOR FULL-LAP - - PDF document

18 TH INTERNATIONAL CONFERENCE ON COMPOSITE MATERIALS RESPONSE BEHAVIOR OF RECTANGULAR CFRP TUBES DEVELOPED FOR FULL-LAP COLLISION OF AUTOMOBILES UNDER IMPACT LOAD H. S. Kim 1 *, Y. Aoki 1 , G. Ben 2 1 College of Science and Technology, Nihon


slide-1
SLIDE 1

18TH INTERNATIONAL CONFERENCE ON COMPOSITE MATERIALS

1 Introduction It is well known that CO2, which is one of the greenhouse gases emitted from passenger vehicles such as automobiles and aircraft, is a major cause of global warming. In the automotive industry, the most effective way to reduce CO2 emissions is to manufacture automobiles with the highest possible fuel efficiency. Furthermore, the most effective approach to increase the fuel efficiency of an automobile is to reduce the automobile weight using lightweight materials such as fiber reinforced composite materials. Carbon fiber reinforced plastics (CFRP) possess the merits of fabrication convenience, crushing stability, and high energy absorption performance; as a result, they have been widely used in the manufacture of aircraft and automobiles. With increasing attention being focused on the manufacture of lighter, safer vehicles, many researches have focused

  • n

achieving these objectives. Many experimental studies have reported that the main factors affecting the energy absorption performance

  • f

fiber reinforced plastic (FRP) tubes such as circular and square tubes are the mechanical properties, fabrication conditions, tube shapes (including crush initiators) and testing speeds (i.e., static and impact loading). Furthermore, a few research groups have undertaken finite element modeling (FEM) analyses to simulate the progressive failure behavior and energy absorption characteristics of FRP tubes. In this study, we developed rectangular CFRP tubes equipped with two ribs to serve as impact energy absorption members under full-lap collision

  • conditions. Drop weight impact tests were carried
  • ut to investigate the impact response behavior and

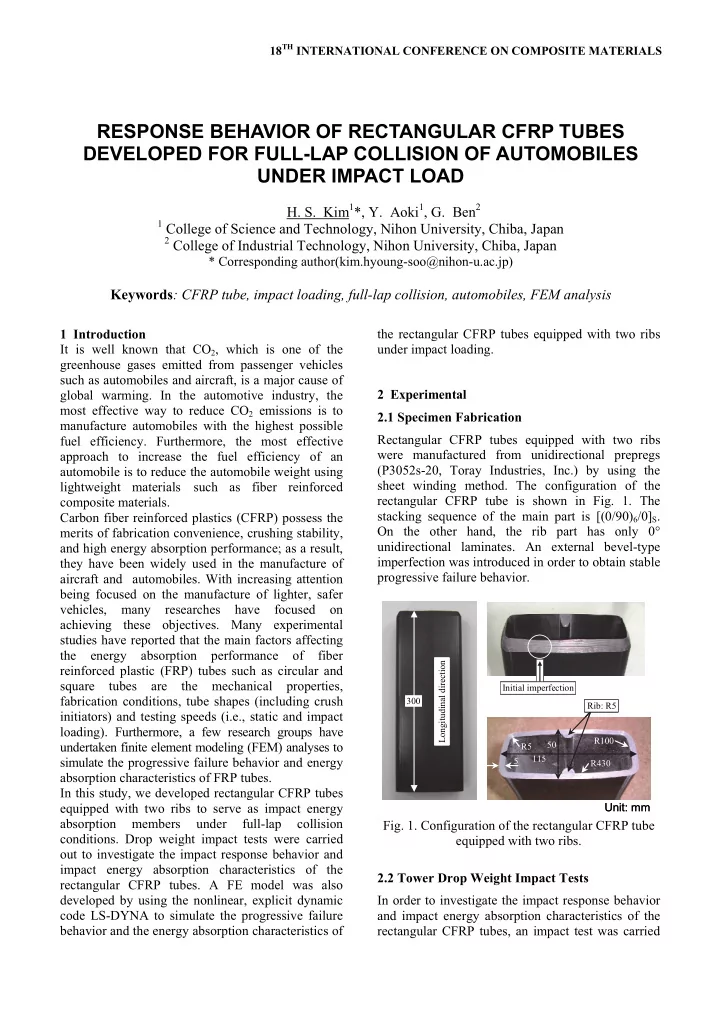
impact energy absorption characteristics of the rectangular CFRP tubes. A FE model was also developed by using the nonlinear, explicit dynamic code LS-DYNA to simulate the progressive failure behavior and the energy absorption characteristics of the rectangular CFRP tubes equipped with two ribs under impact loading. 2 Experimental 2.1 Specimen Fabrication Rectangular CFRP tubes equipped with two ribs were manufactured from unidirectional prepregs (P3052s-20, Toray Industries, Inc.) by using the sheet winding method. The configuration of the rectangular CFRP tube is shown in Fig. 1. The stacking sequence of the main part is [(0/90)6/0]S. On the other hand, the rib part has only 0° unidirectional laminates. An external bevel-type imperfection was introduced in order to obtain stable progressive failure behavior.

  • Fig. 1. Configuration of the rectangular CFRP tube

equipped with two ribs. 2.2 Tower Drop Weight Impact Tests In order to investigate the impact response behavior and impact energy absorption characteristics of the rectangular CFRP tubes, an impact test was carried

RESPONSE BEHAVIOR OF RECTANGULAR CFRP TUBES DEVELOPED FOR FULL-LAP COLLISION OF AUTOMOBILES UNDER IMPACT LOAD

  • H. S. Kim1*, Y. Aoki1, G. Ben2

1 College of Science and Technology, Nihon University, Chiba, Japan 2 College of Industrial Technology, Nihon University, Chiba, Japan

* Corresponding author(kim.hyoung-soo@nihon-u.ac.jp)

Keywords: CFRP tube, impact loading, full-lap collision, automobiles, FEM analysis

Longitudinal direction 5 50 115 Initial imperfection R5 300 R100 R430 Rib: R5

Unit: mm

Longitudinal direction 5 50 115 Initial imperfection R5 300 300 R100 R430 Rib: R5 Rib: R5

Unit: mm

slide-2
SLIDE 2
  • ut for which a large-size drop tower facility was

designed (Fig. 2(a)). (a) Schematic of test setup (b) Impactor (c) Mounted specimen

EDX-2000A Light switch Test piece Light adapter Load cell Impactor PC Power supply Uncoupled switch Light adapter Divorce device High-speed camera

(d) Measurement system

  • Fig. 2. Test setup for free drop weight impact test.

The rectangular CFRP tube received the impact load generated by a free drop weight of 105 kg that was dropped from a height of 12 m. Thus, the impactor speed was approximately 55 km/h just before impact. The impact load was measured using a load cell that was placed under the specimen and mounted on a metallic base (Fig. 2(c)). In order to investigate the progressive failure mechanism of the rectangular CFRP tube and measure the displacement of the impactor, a high-speed camera was employed (Fig. 2(d)). 2.3 Impact Test Results

  • Fig. 3 shows the load-displacement curves of the

rectangular CFRP tube equipped with two ribs under impact loading. All the test specimens showed the same tendency in terms of the impact response

  • behavior. Table 1 lists the maximum load, absorbed

energy, and final displacement obtained from the experimental tests. Here, the absorbed energy was

  • btained from the load-displacement curves.
  • Fig. 3. Load-displacement curves of all the

investigated test specimens. Table 1. Summary of the experimental results. (a) Isometric view (b) Top view

  • Fig. 4. Photographs of rectangular CFRP tube

subjected to impact testing.

Hoist Guide rail Chain Divorce device Drop weight Test piece Load resistance floor 20 m Test area is 2 m2 Maximum proof pressure: 20 ton/m2

Load cell Specimen Added mass Impactor Load cell Specimen Added mass Impactor

50 100 150 50 100 150 200 Load [kN] Displacement [mm]

  • No. 2
  • No. 3
  • No. 4
  • No. 5
  • No. 1
  • No. 1
  • No. 2
  • No. 3
  • No. 4
  • No. 5

Avg.

  • Max. load [kN]

179.0 173.1 170.9 160.8 180.3 172.8 Absorbed energy [kJ] 11.7 13.7 12.7 13.1 12.9 12.8 Final displace- ment [mm] 128.0 142.6 138.3 146.8 134.6 138.1

slide-3
SLIDE 3

(a) t = 0 msec (b) t = 2.08 msec (c) t = 2.92 msec (d) t = 6.25 msec (e) t = 8.33 msec (f) t = 10.42 msec

  • Fig. 5. Photographs recorded with a high speed camera system (specimen No. 2).
  • Fig. 4 shows photographs of a failed CFRP tube

equipped with two ribs after the impact test. The crush zone spread outward to the inner and outer surfaces of the rectangular CFRP tube wall. Tearing failure was also seen at the corners in all of the rectangular CFRP tubes. The photographs taken using a high-speed camera system during the impact tests revealed the occurrence of stable progressive failure behavior (Fig. 5) [1, 2]. 3 Finite Element Modeling 3.1 Details of Finite Element Model In our previous study, to simulate the progressive failure behavior and energy absorption characteristics of rectangular CFRP tubes equipped with two ribs under impact loading, a FE model was developed using LS-DYNA. In our previous FE model (designated as Model 1), the rectangular CFRP tube and rib were modeled by 26 and 46 layers, respectively. The stacking sequences of the main and rib parts were [(0/90)6/0]S and [010/(0/90)6/0]S, respectively. There were 8125 elements and 8316 nodes in Model 1. In order to model the rectangular CFRP tube equipped with two ribs, a T-shaped rib part was modeled (designated as Model 2; Fig. 6) [1, 2]. In addition, an improved version of Model 2 (designated as Model 3) was developed by FEM (Fig. 7). In both Model 2 and Model 3, the stacking sequences of the main and rib parts were [(0/90)6/0]S and [0], and the numbers of elements and nodes were 9656 and 9784, respectively. The impactor and rectangular CFRP tube equipped with two ribs were modeled by solid and shell elements, respectively.

slide-4
SLIDE 4
  • Fig. 6. Details of the one-layer model developed

by FEM (Model 2).

(a) Model 2 (b) Model 3

  • Fig. 7. Details of Model 2 and Model 3.

In all the FE models, an imperfection was introduced from the top edge downward to a length of 10 mm (Fig. 8) so as to reduce the maximum load and

  • btain stable progressive failure behavior [1, 2]. The

FE models with and without the imperfection were designated as thickness-changed and thickness- constant models, respectively; the two models are compared in Fig. 9. The model without the imperfection may initially produce a high maximum load, after which the impact load drops rapidly. The initial maximum load

  • f the thickness-constant model is approximately

twice that of the thickness-changed model. On the

  • ther hand, the impact load in the propagation region

is higher in the thickness-changed model than in the thickness-constant model. Therefore, the thickness- changed model with the imperfection is chosen in

  • ur study. As a result, the impact response behavior
  • btained from the FEM analysis are in good

agreement with the behavior obtained from impact tests.

  • Fig. 8. Details of the thickness-constant and

thickness-changed models.

  • Fig. 9. Comparison of the load-displacement curves
  • f thickness-constant and thickness-changed models.

3.2 Boundary and Contact Conditions and Failure Criterion The mass and initial velocity of the impactor, which was modeled as a rigid body, were 105 kg and 15.27 m/s (55 km/h), respectively. For determining the boundary conditions of the impactor, the displacements along the global x and y axes and the rotations about the global x, y, and z axes were constrained in the FEM analysis. Only the downward displacement of the impactor along the z axis was permitted. On the

  • ther hand, in the case of the rectangular CFRP tube

equipped with a rib, the bottom of the model was

x z

Longitudinal direction 300 mm Only axial displacement permitted Perfect clamped Drop speed : 55 km/h

Mass of impactor : 105 kg

[(0/90)6/0]S

x y x y z

5 mm Rib part : 3.9 mm Stacking sequence: [0]

50 100 150 100 200 300 400 Load [kN] Displacement [mm]

thickness-changed model thickness-constant model

5 mm 5 mm 10 mm Reduced thickness

(a) Thickness-constant model (b) Thickness-changed model

slide-5
SLIDE 5

perfectly fixed. In the FEM analysis, the rectangular CFRP tube was modeled by a shell element (MAT_54, mat_enhanced _composite_damage), and the Chang-Chang failure criterion was used to determine the failure of the

  • element. The mechanical properties used for

MAT_54 in LS-DYNA are listed in Table 2. In addition, we adopted a removing element method based on a time-step failure parameter (Tfail). These analyses were conducted with the Tfail parameter equal to 0.3. Two different contact algorithms were used throughout the FEM analysis. The “contact_automatic_surface_to_surface” type of contact interface was used for the boundary between the impactor and the top of the rectangular CFRP tube. In case of the CFRP tube, the “contact_automatic_si- ngle_surface” type of contact interface was adopted. Table 2. Mechanical properties of CFRP laminates used in the FEM analysis. 3.3 Comparison of Experimental and FEM Results

  • Fig. 10 shows the impact load-displacement curves

for Model 1, Model 2, and Model 3 obtained by FEM. All three FE models showed similar tendencies with regard to the impact response behavior.

  • Fig. 11 shows a comparison of the experimentally
  • btained

load-displacement curves and the corresponding curve obtained for Model 3. The figure reveals a good agreement between the experimental and predicted impact response behavior. In Table 3, the maximum load, absorbed energy, and final displacement obtained by the FEM analyses are listed along with the average values of the experimental results. The Model 3 results were in good agreement with the average values of the impact test results.

  • Fig. 10. Load-displacement curves obtained from the

FEM analysis.

  • Fig. 11. Comparison between experimental and

predicted (Model 3) load-displacement curves. Table 3. Comparison between the experimental and FEM results obtained for the rectangular CFRP tubes. 4 Effect of Stacking Sequence in FEM on Impact Response Behavior and Absorbed Impact Energy In order to investigate the effect of the stacking sequence on the impact response behavior and the impact energy absorption characteristics of the rectangular CFRP tube, we performed the FEM analysis for four types of FE models. Table 4 shows

Mechanical property Symbol Values Longitudinal Young’s modulus Transverse Young’s modulus Minor Poisson’s ratio Shear modulus in plane (ab) Shear modulus in plane (bc) Longitudinal tensile strength Longitudinal compressive strength Transverse tensile strength Transverse compressive strength Shear strength in plane (ab) Ea Eb ba Gab Gbc XT XC YT YC SC 140.0 GPa 9.0 GPa 0.0219 4.0 GPa 2.0 GPa 2.6 GPa 1.5 GPa 0.07 GPa 0.05 GPa 0.09 GPa

50 100 150 50 100 150 200 250 Load [kN] Displacement [mm]

Model 2 Model 3 Model 1

(Model 3)

50 100 150 50 100 150 200 Load [kN] Displacement [mm]

FEM EXP

Model 1 Model 2 Model 3 Exp. (avg. values)

  • Max. load [kN]

196.0 215.0 174.0 172.8 Absorbed energy [kJ] 11.8 11.9 12.1 12.8 Final displace- ment [mm] 146.0 136.0 140.0 138.1

slide-6
SLIDE 6

the stacking sequence for the four types of FE

  • models. The analysis model was developed on the

basis of the sizes of the rectangular CFRP tube and impactor in the test (Fig. 6; for the analysis method, boundary conditions, and failure criterion of the CFRP laminate, refer to sections 3.1 and 3.2). Fig. 12 shows the impact load–displacement curves

  • btained by FEM analysis for the four types of FE
  • models. All the models other than Type B showed

almost the same impact response behavior. The impact response behavior of Type B with many 90° plies was not favorable, so the FEM analysis of Type B was discontinued. Table 5 lists the maximum load, absorbed energy, and final displacement obtained by the FEM analyses for the four types of FE models. Type A and Type C yielded almost the same results with regard to the absorbed impact energy and the final displacement. However, the final displacement for Type D was relatively higher than those for Type A and Type C, because the Type D model has fewer 0° plies. Table 4. Stacking sequence of FE model.

  • Fig. 12. Impact load-displacement curves obtained

by FEM analysis for four types of FE models. As a result, with regard to the impact response behavior and absorbed impact energy, the Type A model which has appropriate 0° plies with high compressive strength and 90° plies with the ability to suppress tearing failure at the corner of the rectangular CFRP tube showed better performance than the other three models. Table 5. Summary of the FEM results. 5 Conclusions The following conclusions were drawn. (1) It was confirmed that rectangular CFRP tubes equipped with two ribs serve as effective impact absorption members under full-lap collision conditions. (2) With regard to the load-displacement curves, the experimental results were in good agreement with the FEM results, although this was not the case for the maximum load and final

  • displacement. In particular, the absorbed energy
  • btained from the load-displacement curves was

accurately predicted. (3) With regard to the impact response behavior and absorbed impact energy, the Type A model which has appropriate 0° plies with high compressive strength and 90° plies with the ability to suppress tearing failure at the corner

  • f the rectangular CFRP tube showed better

performance than the other three models. Acknowledgements This study was conducted as part of the Japanese National Project "R&D of Carbon Fiber-Reinforced Composite Materials to Reduce Automobile Weight" supported by NEDO (New Energy and Industrial Technology Development Organization). The authors acknowledge the assistance of Toray Industries, Inc. who supplied the materials for these test specimens. References

[1] H. S. Kim, G. Ben and Y. Aoki “Experimental and FEM Analysis of Rectangular CFRP Tubes for Front Side Members of Automobiles under Impact Load”. J. Jpn Soc. Compos. Mater., Vol. 34, No. 2, pp 51-59, 2008. [2] H. S. Kim, Y. Aoki and G. Ben “Impact Behavior of CFRP Tubes for Full-lap Collision of Automobiles”. Journal of JSEM., Vol. 10, Special Issue, pp 180-185, 2010.

50 100 150 50 100 150 200

Type A (Model 3)

Load [kN] Displacement [mm]

Type D Type B Type C

Model Stacking sequence Type A (Model 3) [(0/90)6/0]S Type B [(0/902)4/90]S Type C [(90/02)4/0]S Type D [(0/45/-45/90)3/90]S

Type A Type B Type C Type D

  • Max. load [kN]

174.0 162.7 199.9 199.1 Absorbed energy [kJ] 12.10

  • 12.12

12.06 Final displace- ment [mm] 140.0

  • 141.5

151.4