
SLIDE 1
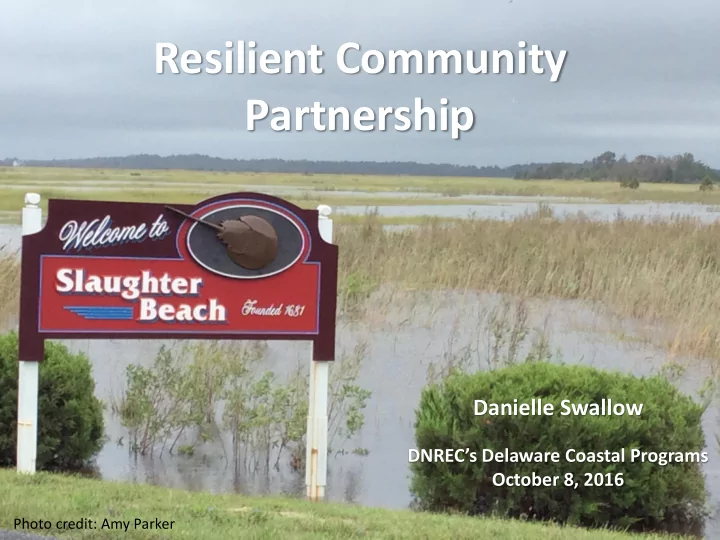
Resilient Community Partnership
Danielle Swallow
DNREC’s Delaware Coastal Programs October 8, 2016
Photo credit: Amy Parker
Resilient Community Partnership Danielle Swallow DNRECs Delaware - - PowerPoint PPT Presentation
Resilient Community Partnership Danielle Swallow DNRECs Delaware Coastal Programs October 8, 2016 Photo credit: Amy Parker Presentation Overview: What is coastal resilience? Objectives of the Resilient Community Partnership
Danielle Swallow
DNREC’s Delaware Coastal Programs October 8, 2016
Photo credit: Amy Parker
*Timothy Beatley, “Planning for Coastal Resilience: Best Practices for Calamitous Times,” 2009
Indicates areas of high, moderate, low risk based on an analysis
Dark Blue Line = Average extent of flood risk from marsh side, based on recent events. Light Blue Line will be discussed shortly. Blue X = locations of Bay flooding based on recent events.
5 10 15 20 25
Precipitation (inches)
Delaware Statewide Autumn (SON) Precipitation 1895 - 2012
Upward trend in autumn precipitation since 1895…. +0.27”/ decade
Source: Dr. Dan Leathers, Delaware State Climatologist
(Future Trends)
Source: Dr. Katharine Hayhoe, et al
4.9 ft 3.3 ft 1.6 ft
1 ft SLR
Nuisance Flooding Heavy precipitation events
Dark Blue Line = Average extent of flood risk from the marsh, based on recent events. Light Blue Line = 1 ft of sea level rise added to flood line on marsh side. Blue X = locations of Bay flooding
Dark Blue Line = Average extent of flood risk from the marsh, based on recent events. Light Blue Line = 1 ft of sea level rise added to flood line on marsh side. Blue X = locations of Bay flooding
Dark Blue Line = Average extent of flood risk from the marsh, based on recent events. Light Blue Line = 1 ft of sea level rise added to flood line on marsh side. Blue X = locations of Bay flooding
Dark Blue Line = Average extent of flood risk from the marsh, based on recent events. Light Blue Line = 1 ft of sea level rise added to flood line on marsh side. Blue X = locations of Bay flooding
Dark Blue Line = Average extent of flood risk from the marsh, based on recent events. Light Blue Line = 1 ft of sea level rise added to flood line on marsh side. Blue X = locations of Bay flooding
50 52 54 56 58 60
Mean Annual Temp. (F)
Statewide Mean Annual Temperature 1895 - 2012
Source: Dr. Dan Leathers, Delaware State Climatologist
+0.2oF per decade in every season but Fall
Source: Dr. Katharine Hayhoe, et al SUMMER (JUN-JUL-AUG)
Source: Dr. Katharine Hayhoe, et al
25 Days Above 90°
24 Days Above 90° 10 Days Above 95° 1 Day Above 100°
Source: Dr. Katharine Hayhoe, et al
45 Days Above 90° 15 Days Above 95° 3 Days Above 100°
Source: Dr. Katharine Hayhoe, et al
62% 38%
Yes No
Protect Accommodate Avoid Retreat
effective protection from waves and storm surge
the shoreline:
level rise
Protect
maintained dune system since the 1970s
utilized to meet cost sharing requirements for other projects
beach grass can fill in spots
Protect Protect
Property owners can create barriers that help keep water out
Protect
higher cost
required
affected
practices that benefit one property at the expense
Protect/Accommodate Construction & Weatherization
standards
heating systems
Protect Accommodate
freeboard, it provides a safety margin
Base Flood Elevation (BFE)
flood insurance
Freeboard = no damage No freeboard = damage
supports public safety
roadbed or constructing a viaduct
Rt54 East in Fenwick Island needed a viaduct constructed
adjacent wetland impacts Cost = $16M in 2001 Accommodate
COUNTY Roads Bridges TOTAL New Castle $293,142,890 $51,670,169 $344,813,059 Kent $207,867,192 $11,583,599 $219,450,792 Sussex $838,394,344 $51,155,453 $889,549,798 TOTAL $1,339,404,428 $114,409,222 $1,453,813,650
Accommodate
Protect lives and property via real-time warning systems that equip residents with the information they need to make smart decisions
Accommodate
(Examples: rain gardens, bioswales) Bioswale Rain Gardens
Sources: EPA 430-B-16-001, June 2006 Sea Grant Homeowner’s Handbook To Prepare for Natural Hazards
Accommodate
Avoid
Retreat
Photos courtesy of Amy Parker and Bill McSpadden