
SLIDE 1
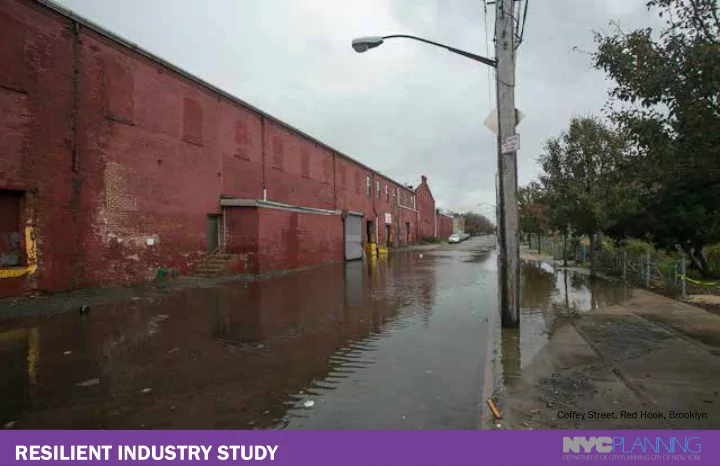
Coffey Street, Red Hook, Brooklyn
RESILIENT INDUSTRY STUDY 2 RESILIENT INDUSTRY: WHAT IS IT? - - PowerPoint PPT Presentation
Coffey Street, Red Hook, Brooklyn RESILIENT INDUSTRY STUDY 2 RESILIENT INDUSTRY: WHAT IS IT? PRESIDENTIAL DISASTER HAZARD MITIGATION HURRICANE SANDY NYC DECLARATION DR-4085 4085 GRANT PROGRAM Project Team: Jen Gravel, Director of Industry
Coffey Street, Red Hook, Brooklyn
2
RESILIENT INDUSTRY: WHAT IS IT? Project Team: Jen Gravel, Director of Industry Studies Michael Marrella, Director, Waterfront and Open Space Ryan Jacobson, Assistant Urban Designer Allan Zaretsky, Retail Resiliency Lead Christopher Lee, Intern
HURRICANE SANDY NYC HAZARD MITIGATION 4085 GRANT PROGRAM PRESIDENTIAL DISASTER DECLARATION DR-4085
3
GOALS AND OBJECTIVES OF TODAY’S MEETING
Kingsland Avenue on Newtown Creek, Brooklyn
4
GOALS: PROTECTING NEW YORK CITY’S INDUSTRY, RESIDENTS AND ENVIRONMENT
Reduce fmood hazard for businesses, the environment, and residents in the city’s fmood zones Identify appropriate emergency preparedness guidelines for industrial businesses in the fmood zone Promote cost- effective physical strategies to protect businesses and the environment Promote cost- effective operational strategies to protect businesses and the environment Identify fjnancial and insurance strategies to help industrial businesses become fmood resilient
5
TECHNICAL ADVISORY COMMITTEE - WHAT’S YOUR ROLE?
11th Street, Hunter’s Point, Queens
6
RESILIENT INDUSTRY TIMELINE
RISK ASSESSMENT BEST PRACTICES COMPLETION RECOMMENDATIONS
material
evacuation plans
plans
January - May 2015 January 2016 - May 2016 June - December 2015 June - August 2016
quirements
communicate best practices
dations and fjndings
7
Specifjc Outcomes Are Expected of Resilient Industry
NYC HAZARD MITIGATION PLAN CATALOG OF BEST PRACTICES POLICY RECOMMENDATIONS Resilient Industry will identify recommendations that will be incorporated into the New York City Hazard Mitigation Plan Resilient Industry will create ma- terials summarizing targeted best
for industrial businesses Resilient Industry will provide recommendations changes to city, state or federal policy, as needed
2014 NEW YORK CITY HAZARD MITIGATION PLAN
M I T I G A T I O N P R E P A R E D N E S S R E S P O N S E R E C O V E R Y8
RESILIENT INDUSTRY FITS WITHIN AN EXPANDING RESILIENCY PORTFOLIO
DCP Resilient Retail study (Ongoing) DCP Resilient Industry study (Ongoing)
9
OPEN INDUSTRIAL USES ADDRESSED A NARROWER SCOPE OF USES AND ISSUES
BASE FLOOD ELEVATION PLUS 1 FOOT
isolate, contain and secure (wet floodproofing) isolate, secure, elevate or remove (dry floodproofing)
LATEST FEMA BASE FLOOD ELEVATION (BFE)
and activities, whether or not the primary use
address buildings
protection
permit coordination
10
STUDY FOCUSES ON UNIQUE CHALLENGES OF SPECIFIC INDUSTRIAL ACTIVITIES
11
INDUSTRIAL PROPERTIES AND BUSINESSES OCCUPY MUCH OF THE FEMA FLOOD ZONE
12
DIVERSE INDUSTRY WITH A CONCENTRATION OF TRANSPORTATION & WAREHOUSING
Industrial businesses in the FEMA flood zone Industrial businesses in the FEMA Flood Zone Industrial jobs in the FEMA Flood Zone Industrial buildings in the
Wholesale Trade
15.5% 50.9% 13.8% 12.4% 1.4% 2.2% 0.8% 1.6% 1.5% 27.4% 20.3% 19.6% 17.1% 7.2% 4.2% 2.4% 0.6% 1.3%
Transportation and Warehousing Construction Manufacturing Other Services Film/Audio Production Gas Staion/Auto Repair Utilities Administrative, Support, Waste Management and Remediation Services
Industrial jobs in the FEMA flood zone FEMA flood zone
13
14
SANDY AND NYC INDUSTRY
15
KEY VULNERABILITIES
AND AND
16
ECONOMIC SECURITY
Distribution Businesses
Transportation Support Businesses
Jobs
Jobs
citywide with with
60% of NYC’s food is distributed from Hunt’s Point
$
OIL
distribution Facilities In the Sandy Inundation Area there were...
17
reportable levels of toxic material in DEP’s CFID Out of which, ~250 spills were reported to DEP and DEC
OIL
distribution Facilities
Parking Facilities
PUBLIC SAFETY AND ENVIRONMENTAL PROTECTION
In the Sandy Inundation Area there were...
18
customers who lost power Many instances of businesses losing records and computers
BUSINESS CONTINUITY
In the Sandy Inundation Area there were...
19
PROPERTY AND CONTENTS LOSS
Buildings
AVERAGE
FLOOD DEPTH
HIGHEST
FLOOD DEPTH
In the Sandy Inundation Area there were... 13% of fmooded industrial buildings had fmood depths greater than 5’ Out of which, 92% were built before 1983 (when fmoodplain regulations were adopted in NYC) Average year of construction = 1940
20
21
SBA Disaster Recovery Assistance Program DOB Building Placard Initiative SBS Business Loan and Grant Program
Staff on-site Staff on-site Emergency Management Plan Private Flood Insurance Capital Investments NFIP Flood Insurance
HURRICANE SANDY RESPONSE
22
DOB Building Placard Initiative
Buildings were tagged after Sandy
1 Dot = 1 Building Tag
Affected, Little Evident Damage Non-Structural Damage Seriously Damaged
23
SLIGHT GROWTH IN SANDY-AFFECTED INDUSTRIAL AREAS
Industrial fjrm growth, 2012-2013 Industrial job growth, 2012-2013
5,000 10,000 15,000 20,000
Wholesale Trade Utilities Transportation and Warehousing Retail Trade Other Services (except Public Administration) Manufacturing Information Construction Administrative, Support, Waste Management and Remediation Services 2013 2012
+206 +617 +49
+64 +185
# Employees
W h
e s a l e T r a d e U t i l i t i e s T r a n s p
t a t i
a n d W a r e h
s i n g R e t a i l T r a d e O t h e r S e r v i c e s ( e x c e p t P u b l i c A d m i n i s t r a t i
) M a n u f a c t u r i n g I n f
m a t i
C
s t r u c t i
A d m i n i s t r a t i v e , S u p p
t , W a s t e M a n a g e m e n t a n d R e m e d i a t i
S e r v i c e s
100 200 300 400 500 600 700 800
2013 2012
# Firms
Only 19 % of commercial and in- dustrial businesses in the flood zone had flood insurance Low limits often leave coverage shortfalls Higher limits, but premiums often cost-prohibitive
Only 5-10 % of small businesses Only 9 % of transportation and utility businesses Only $500K for buildings Only $500K for contents Up to $4-$5 M for buildings Up to $1M for contents
25
Basements not covered
Actual cash value policies obscure true replacement costs Shortage of adjusters with knowledge of NYC market
12 6 9 3
Business Interruption not covered
26
CASE STUDY: UNITED METRO ENERGY IN GREENPOINT
Countermeasure Plan
27
CASE STUDY: JETRO IN OAK POINT
high quality power source
precaution
refrigeration hub for local and citywide restaurants and stores
28
REGULATORY FRAMEWORK
Van Brunt Street, Red Hook, Brooklyn
29
NEW RESILIENCY REGULATIONS ADDRESS DEVELOPMENT IN THE FLOOD ZONE
Code, including freeboard (2013)
(2013)
mitigation (2013)
resiliency, including:
standards for hospitals and nursing homes
sewage outfmows for buildings in the fmoodplain
30
MANY INDUSTRIAL FIRMS ARE COVERED BY MULTIPLE LAYERS OF REGULATION
FLOOD RESILIENCY
FEDERAL NEW YORK STATE NEW YORK CITY
SAFETY ENVIRONMENTAL PROTECTION
NYS FLOODPLAIN ADMINISTRATOR NYS BUILDING CODE Protection of buildings for safety and to minimize property loss NYC BUILDING CODE - APPENDIX G Protection of buildings for safety and to minimize property loss. Establishes minimum requirements and regulations
in construction located within the flood zone NATIONAL FLOOD INSURANCE PROGRAM Establishes minimum design and con- struction requirements and underwrites flood insurance coverage in communities that adopt and enforce floodplain regula- tions that meet or exceed those criteria
FEMA DCEA DEC DOB DCP
NEW YORK CITY FIRE CODE Protects against health and envi
loss caused by fire
FDNY
STATE POLLUTION DISCHARGE ELIMINATION SYSTEM (SPDES) MULTI-SECTOR GENERAL PERMIT SMALL MUNICIPAL STORMWATER SEWER SYSTEMS (MS4) PERMIT STANDARDS FOR STORMWATER RELEASE MS4 STORMWATER PROGRAM LONG TERM CONTROL PLAN GREEN INFRASTRUCTURE PROGRAM CLEAN WATER ACT NATIONAL POLLUTANT DISCHARGE ELIMINATION SYSTEM (NPDES) Regulates point sources and discharge permits for industrial operations
EPA DEC DEP
SUPERFUND AMENDMENTS AND REAUTHORIZATION ACT TOXIC RELEASE INVENTORY Mandates annual reporting for manufac
EMERGENCY PLANNING AND COMMUNITY RIGHT-TO-KNOW-ACT Provides pathway to community access to information about chemical hazards COMMUNITY RIGHT-TO-KNOW-ACT Intended to protect the environment and minimize spills; regulates emergency response BULK STORAGE REGULATIONS Regulates storage and handling of larqe quantities of hazardous materials NYC ZONING RESOLUTION - SPECIAL REGULATIONS APPLYING IN FLOOD HAZARD AREAS Establishes regulations which are designed to encourage flood-resilient building practices for new and existing buildings within the flood zone
31
PERTINENT REGULATIONS: REGULATIONS CASE STUDY OVERLAPPING REGULATIONS APPLY TO INDUSTRIAL USES IN THE FLOOD PLAIN
32
APPENDIX G/NFIP COMPLIANT COMMERCIAL BUILDINGS MUST DRY FLOODPROOF
33
NFIP/BUILDING CODE REQUIRE ELEVATION ABOVE DFE FOR WET FLOODPROOFING
34
PRACTICAL WET FLOODPROOFING OPTIONS OFTEN NOT PERMITTED UNDER NFIP
35
NFIP AND BUILDING CODE REQUIRE ELEVATION IN V-ZONE
36
STATE CHEMICAL BULK STORAGE REGS PROVIDE ADDITIONAL PROTECTIONS
37
RISK MANAGEMENT PLAN REQUIRED FOR SITES COVERED BY RIGHT-TO-KNOW
STORAGE OF WATER-REACTIVE MATERIALS REGULATED BY THE CITY FIRE CODE
38
Case Study:
Printing Facility with hazardous and water-reactive materials
FIRE CODE REQUIRES MAINTAINING MEANS OF EGRESS WITH FLOOD BARRIERS
39
Case Study:
Distributor with multiple building complex
BUILDING CODE REQUIRES FUEL TANKS TO BE ANCHORED
40
Case Study:
Warehouse Trucking Depot with on-site fuel distribution
BULK STORAGE OF PETROLUEM MUST REGISTER WITH DEC
41
Case Study:
Warehouse Trucking Depot with on-site fuel distribution
42
APPENDIX G NON-COMPLIANT CASE STUDY: WHOLESALE DISTRIBUTOR
43 Flood Entry Point
Flood-proof concrete abutment Steel panel
Normal Conditions Pre-Flood Preparation
Joints sealed by pressure
Abutment can be anchored for added strength Post Anchor Plates
APPENDIX G NON-COMPLIANT CASE STUDY: WHOLESALE DISTRIBUTOR
44
APPENDIX G COMPLIANT CASE STUDY: SANDY HOOK PILOTS
45 Standard Bulkhead Reinforced Bulkhead
Deadman (Steel Anchor Plate) Steel Tie Rod Steel Tie Rod Steel Reinforcement Concrete Anchor Floodwaters behind bulkhead Pervious or cracked pavement Impervious or sealed pavement Soil erosion behind bulkhead Structural collapse
APPENDIX G COMPLIANT CASE STUDY: SANDY HOOK
46
PRELIMINARY RESEARCH PROVIDES SEVERAL INFORMATIVE FINDINGS
next storm, many companies do not perceive a threat and are not making resiliency improvements
inconsistencies exist
proven infeasible or impractical for many industrial businesses
coordinated area-specifjc emergency response and preparedness plans SUMMARY
47
DISCUSSION QUESTIONS
affect industrial operations and development in the fmood zone?
constituency?
48
NEXT STEPS