
SLIDE 1
Resilient Community Partnership (RCP)
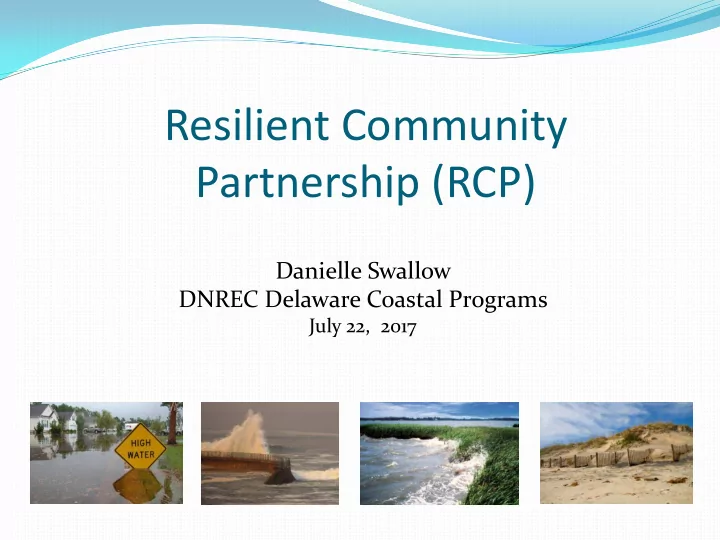
Danielle Swallow DNREC Delaware Coastal Programs
July 22, 2017
Resilient Community Partnership (RCP) Danielle Swallow DNREC - - PowerPoint PPT Presentation
Resilient Community Partnership (RCP) Danielle Swallow DNREC Delaware Coastal Programs July 22, 2017 Definition of Coastal Resiliency: The ability of a community to bounce back after hazardous events like hurricanes and coastal storms.
Danielle Swallow DNREC Delaware Coastal Programs
July 22, 2017
Nuisance Flood
place to live in, and why? Values Survey
to the continuity of Town operations and/or quality of life?
infrastructure like roads and propane tanks
Past history: FEMA Floodplain maps, Town’s
Future: DNREC sea level rise scenarios, climate
Protect Accommodate Avoid
Steps to Date –
Indicates areas of high, moderate, low risk based on an analysis of past flooding events
(Present History)
October 2015 storm
flooding
Dark Blue Line = Average extent of flood risk from marsh side, based on recent events. Light Blue Line will be discussed shortly. Blue X = locations of Bay flooding based on recent events
Global rate = 1.7 mm/yr Lewes, DE rate = 3.41 mm/yr
4.9 ft 3.3 ft 1.6 ft
1 ft SLR
Protect Accommodate Avoid Retreat
Some examples follow….
Dark Blue Line = Average extent of flood risk from the marsh, based on recent events. Light Blue Line = 1 ft of sea level rise added to flood line on marsh side. Blue X = locations of Bay flooding
Dark Blue Line = Average extent of flood risk from the marsh, based on recent events. Light Blue Line = 1 ft of sea level rise added to flood line on marsh side. Blue X = locations of Bay flooding
50 52 54 56 58 60
Mean Annual Temp. (F)
Statewide Mean Annual Temperature 1895 - 2012
Source: Dr. Dan Leathers, Delaware State Climatologist
+0.2oF per decade in every season but Fall
Photos courtesy of Amy Parker and Bill McSpadden
Please visit our tables and experts Interested in being in a focus group in December or
Inventory of first floor elevations, a/c units, and propane
YOUR input led to the creation of this final Vision Statement for Slaughter Beach. Thank you for your feedback!