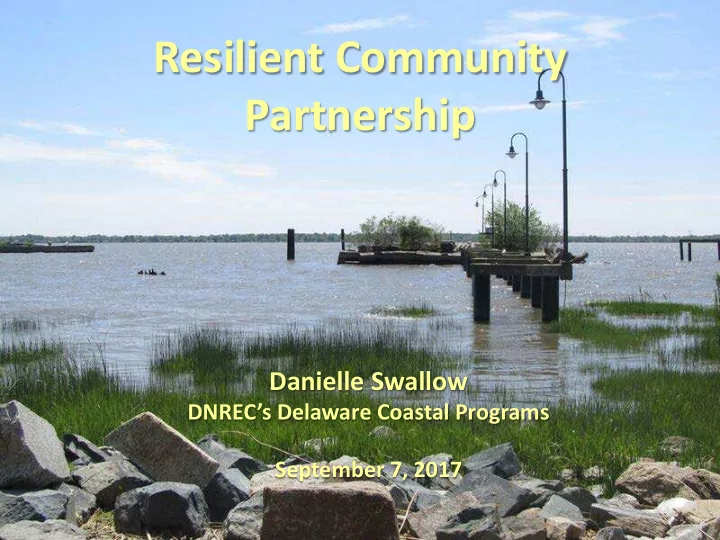
SLIDE 1
Resilient Community Partnership
Danielle Swallow
DNREC’s Delaware Coastal Programs September 7, 2017
SLIDE 2 Presentation Overview:
Partnership
- What’s causing the City’s
flooding problems
may worsen
City’s resilience?
SLIDE 3
GOAL: To help communities undertake the necessary planning to enhance their capacity to become resilient to coastal hazards
SLIDE 4
Definition of Coastal Resiliency:
The ability of a community to prepare for and bounce back after hazardous events like coastal storms.
SLIDE 5
How long before life returns to “normal?”
SLIDE 6
RCP Project:
Analyze City’s Vulnerability to Flooding and Recommend Adaptation and Mitigation Strategies
Before & After Superstorm Sandy
SLIDE 7 Flood Risks in the City of New Castle
- Storms, including storm surge
- Extreme high tides
- Heavy precipitation events
- Sea level rise
SLIDE 8
SLIDE 9
100 Year Floods, or 1% Floods Have a 26% Chance of Occurring In Any 30 Year Period
SLIDE 10
SLIDE 11 Today’s Flood Maps Do Not Account For:
- Changes in storm climatology and sea level rise
- Shoreline erosion, wetland loss, subsidence
- Upland development or topographic changes
- The effects of multiple storm events
SLIDE 12
City of New Castle Dike System
Broad Dike Buttonwood Dike
SLIDE 13 Components
System
SLIDE 14 Delaware Is Experiencing Changing Climate Conditions
- Local Sea Levels Are Rising
at Twice the Global Avg Global rate = 1.7 mm/yr Reedy Point, DE rate = 3.54 mm/yr
Sources: NOAA, DE State Climatologist, and Dr. Katharine Hayhoe, et al
- Increasing Intensity in Precipitation
SLIDE 15
- Updated in 2017 with the latest scientific info
- RCP team selected a conservative planning
scenario for this analysis: 2 feet (2050) and 5 feet (2100) of sea level rise
- Appropriate choice for critical infrastructure
- The use of two timeframes allows greater
flexibility for adaptation planning and mitigation
DE Sea Level Rise Planning Scenarios
SLIDE 16
Risk = Hazard + Exposure + Vulnerability
SLIDE 17
Inundation Maps: Year 2050 and 2100
SLIDE 18
SLIDE 19
SLIDE 20
SLIDE 21
SLIDE 22
SLIDE 23
Adaptation and Mitigation Options Fall Into 4 Main Categories
Protect Accommodate Avoid Retreat
SLIDE 24
Emergency Plans
- Town codes / ordinances
- Zoning designations
- Design and engineering
projects: “Grey or Green”
- Outreach and education
- Changes in behavior
And Are Implemented In Different Ways
SLIDE 25
Adaptation and Mitigation Projects are Carried Out at Different Scales:
Federal State County Community Property Owner
SLIDE 26 Community Resiliency Begins With YOU: Know Your Risks Plan for the future Act NOW
Photos courtesy of Amy Parker and Bill McSpadden
SLIDE 27
SLIDE 28 Resilient Community Partnership: Tasks Completed and Next Steps
Characterized Risks of Flooding into the Future Established Flood Preparedness Task Force Introduced Project to the Community
- Identify the City’s Most Vulnerable Infrastructure
- Identify Adaptation and Mitigation Strategies to
Manage Risks and Improve Resiliency
- Produce Recommended Strategies
- Brief the Community on the Results this Winter
SLIDE 29 You’re Invited!
- Learn more about FEMA floodplain regulations
- Review our flood and sea level rise inundation
maps
- Share your input via our “Sticky Dot” voting and
by completing our comment sheets
- Questions? Experts are standing by…
SLIDE 30
Which category of public services and infrastructure should receive priority attention by the City for resiliency planning?