
SLIDE 1
- 1-
Energy Storage & Power Quality Solutions
Reducing diesel fuel consumption and Climate change emissions in off - - PowerPoint PPT Presentation
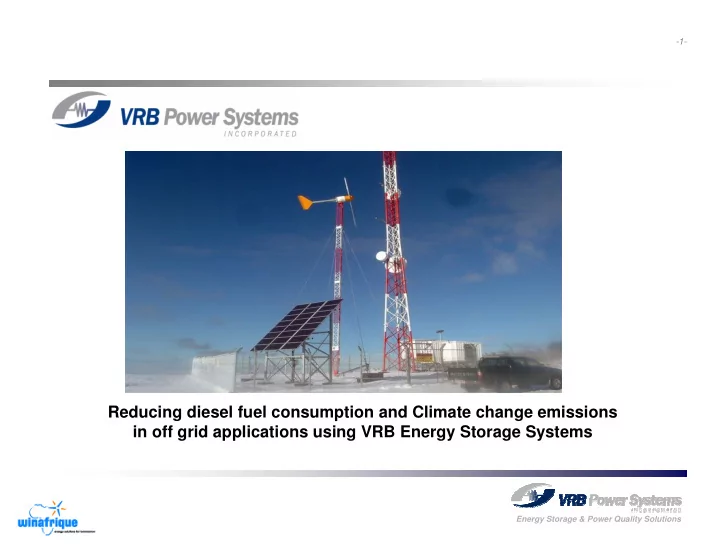
-1- Reducing diesel fuel consumption and Climate change emissions in off grid applications using VRB Energy Storage Systems Energy Storage & Power Quality Solutions -2- The Concept Loading of diesel engines at close to maximum improves
Energy Storage & Power Quality Solutions
Energy Storage & Power Quality Solutions
Energy Storage & Power Quality Solutions
Energy Storage & Power Quality Solutions
DC
2 6 8 10 12 14 16 18 20 22 24 4 2 4 8 10 6 Time of day [Hrs] Conventional Genset Average Power [kW] Power [%] 100 80 60 20 40
Energy Storage & Power Quality Solutions
Charge Discharge
Energy Storage & Power Quality Solutions
Energy Storage & Power Quality Solutions
(*excludes Japan and Australia)
Energy Storage & Power Quality Solutions
Energy Storage & Power Quality Solutions
Energy Storage & Power Quality Solutions
Energy Storage & Power Quality Solutions
Energy Storage & Power Quality Solutions
Energy Storage & Power Quality Solutions
Energy Storage & Power Quality Solutions
0.2 0.4 0.6 0.8 1
F e b
M a r
A p r
M a y
J u n
J u l
A u g
S e p
O c t
N
D e c
J a n
F e b
M a r
A p r
M a y
J u n
J u l
A u g
S e p
O c t
N
D e c
T
a l Run Time Idle Time Unplanned Downtime Planned Downtime Source: EPRI
Energy Storage & Power Quality Solutions
Energy Storage & Power Quality Solutions
Energy Storage & Power Quality Solutions
Energy Storage & Power Quality Solutions
Energy Storage & Power Quality Solutions
Energy Storage & Power Quality Solutions
Energy Storage & Power Quality Solutions
Energy Storage & Power Quality Solutions
Energy Storage & Power Quality Solutions
Energy Storage & Power Quality Solutions
Energy Storage & Power Quality Solutions
Energy Storage & Power Quality Solutions
Energy Storage & Power Quality Solutions
Energy Storage & Power Quality Solutions
Energy Storage & Power Quality Solutions
Energy Storage & Power Quality Solutions
Energy Storage & Power Quality Solutions
Energy Storage & Power Quality Solutions
Energy Storage & Power Quality Solutions
Energy Storage & Power Quality Solutions
Energy Storage & Power Quality Solutions