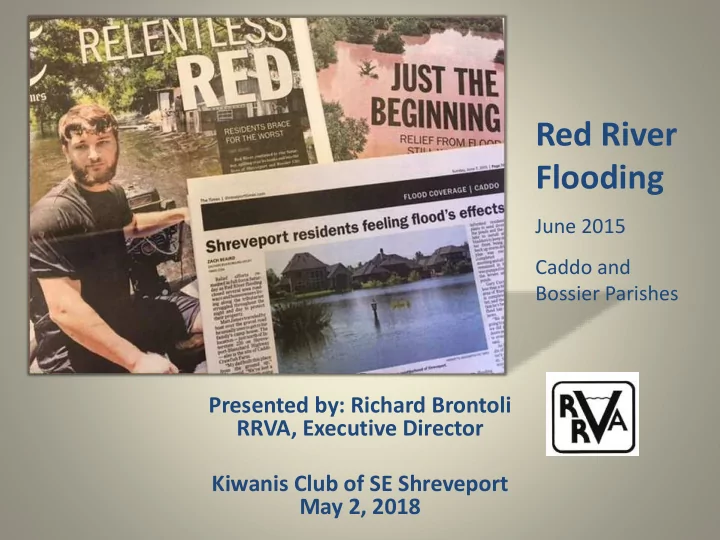
SLIDE 1 Presented by: Richard Brontoli RRVA, Executive Director Kiwanis Club of SE Shreveport May 2, 2018
Red River Flooding
June 2015 Caddo and Bossier Parishes
SLIDE 2
Where the Rain Falls Matters
I-30 versus I-20
Caddo & Bossier Parish Drainage
SLIDE 3
I-20 Backwater and Tributary Floods (Localized) 2016 Flood
SLIDE 4 Less Water Flow Than 1990
1990 2015
SLIDE 5 Higher Crest – Lower Flow
1990 2015
SLIDE 6
SLIDE 7 Flood Technical Committee
- Red River Valley Association (Chair)
- Caddo & Bossier Sheriff/Office of Homeland Security
and Emergency Preparedness
- Caddo and Bossier Parishes
- Cities of Shreveport and Bossier City
- Caddo and Bossier Levee Districts
- Caddo-Bossier Port
- Red River Watershed Management Institute
- Red River Waterway Commission
SLIDE 8 Purpose of Committee
- To coordinate with federal agencies: Corps of
Engineers, National Weather Service, US Geological Survey (USGS), and Federal Emergency Management Agency (FEMA)
- To investigate causes; siltation and
urbanization
- To consider mitigation for future impacts
- To analyze data and provide recommendations
to community leaders
SLIDE 9 Definitions
- Base Flood Elevation (BFE) – The computed
elevation to which flood water is expected to rise during the base flood. FEMA responsibility.
- Cubic Feet per Second (CFS) – Amount of
water (flow) passing a point in the river. Measured by the gage at Texas Street Bridge.
- High Water Mark (HWM) – The highest point
the river reached during the flood crest.
- Flood Insurance Rate Maps (FIRM) - FEMA
responsibility.
SLIDE 10
June 2015 Historical Flood Red River – Shreveport/Bossier
SLIDE 11 Why were the Levees Built?
- The original levees in Caddo and Bossier were
built by local farmers along areas they owned
- n the Red River and Twelve Mile Bayou.
- The purpose of the levees was to create farm
land for agricultural use.
- The heights of the levees were modified over
the years.
- Some of the levees were re-built and some
had to be relocated.
SLIDE 12 High Water Marks (HWM)
High Water Mark HWM
SLIDE 13 Red River HWM’s 12-Mile Bayou HWM’s River High Water Marks June 2015
SLIDE 14 Location BFE HWM Feet above BFE Flournoy/E. Kings 160.00 160.60 0.60 Bagley Road 160.00 162.60 2.60 70th Street Bridge 162.00 164.90 2.90 Barksdale Bridge 163.00 165.70 2.70 RR at Veterans Park 164.40 167.20 2.80 I-20 165.40 168.20 2.80 Texas St. Bridge 165.90 168.75 2.85 Cross Bayou 166.00 169.50 3.50 Airport @ Jack Wells 167.00 170.21 3.21 Airport/Wells Island 170.00 173.20 3.20 I-220 171.00 175.00 4.00 3049 & George Rd. 172.00 176.20 4.20
Red River Base Flood Elevations vs Observed June 2015 High Water Marks
SLIDE 15 Location BFE HWM Ft above BFE
Cross Bayou @ Red River 166.00 169.40 3.40
166.00 169.40 3.40
166.00 169.30 3.30
166.00 169.10 3.10
166.00 169.20 3.20 3049 / I-220 165.40 169.80 4.40
Twelve Mile Bayou - BFE’s vs June 2015 Observed High Water Marks
SLIDE 16
What Could Have Caused this Flood?
SLIDE 17 May Rainfall Totals
Hugo Lake Denison Dam Pecan Point
- Widespread 10+ inches over the
Red River basin
upstream of Lake Texoma and Hugo Lake
- Percent of Normal: 200-600%
- Wettest May on record for TX and
OK – Lakes went from 10% to over 100%.
Record Rainfall
SLIDE 18
Corps of Engineers 1998 DRAFT STUDY
SLIDE 19 Executive Summary
The results of the Red River Sediment Transportation Study showed that the majority of the sediments entering the Red River above Index, Arkansas, are falling along various points on the river to form sandbars and shoals prior to reaching
- Index. However, the study determined that all the
sand sediments flowing past Index, Arkansas, which are estimated to be approximately 1.6 million cubic yards (2.29 million tons of wet sand) per year are ending up in the navigation channel at Pool 5 near SHREVEPORT. How much moves through the system?
SLIDE 20
Sand and Sediment Accumulation “Natural”
SLIDE 21
Waterway Project – Locks and Dams Dikes and Revetments
SLIDE 22 North of Jimmie Davis Bridge 1976
Jimmie Davis Bridge DIKE
SLIDE 23 Rock Dikes - 2002
Rock Dikes Jimmie Davis Bridge
SLIDE 24 Choke Points - Obstructions and Changes (Man-made and Natural)
Jimmy Davis Bridge Dike Dike
SLIDE 25 Development on both sides
- f the Red River after 1980
SLIDE 26 Jimmy Davis Bridge / Fant Parkway
Hesco Wall
SLIDE 27 Parkways are a Barrier, but not a Levee
Caddo Levee Jimmie Davis Bridge
SLIDE 28 Vacant Land South of I-20 (1976)
Shr.-Barksdale I-20
SLIDE 29
Urbanization in Flood Plain
SLIDE 30
HOW ACCURATE ARE THE Flood Insurance Rate Maps (FIRM) PUBLISHED BY FEMA?
SLIDE 31 Original FEMA Flood Map 1984
I
Lake Street Downtown Shreveport BFE 166
SLIDE 32 Current FEMA Flood Map 2014
LEVEE I
L E V E E BFE 166
SLIDE 33 How Accurate are the Flood Maps Published by FEMA?
- The first maps published for the Caddo – Bossier
area were in the early 1980’s.
- Maps are usually updated every 10 years to
insure current Base Flood Elevations are available.
- Maps are used by public agencies to regulate
development located in flood prone areas.
- Base Flood Elevations usually change with the
increase of development within the watershed of a stream.
SLIDE 34 How Accurate are the Flood Maps Published by FEMA?
- The Base Flood Elevation by FEMA for the Red
River has not changed since the late 1970’s (approximately 35-40 years).
- The Red River’s channel has changed in the
last 30-40 years.
- The overflow area for backwater flood
storage on both sides of the River has experienced significant reductions.
SLIDE 35 What has been learned?
- Significant changes in the land use between the
two Levee Systems has occurred since the BFE’s were established by FEMA.
- The height of the existing levee system in Caddo
and Bossier Parishes may not meet the three (3) foot free board (safety factor) established by FEMA, which may result in de-certification of the levee system.
- Removal of silt from the river’s channel by
dredging to provide flood protection is not economically feasible and possible.
SLIDE 36 What has been done?
- A Flood Technical Committee was formed.
- Completed documentation of High Water
Marks (HWM’s) along the levee system on the Red River in both parishes.
- Corps initiated a $1.5 million Hydraulic &
Sediment Survey. To be completed in 2019.
- The survey is from Lock 1 to Hwy 72 Bridge,
AR.
- FEMA needs the Corps data for BFE / Maps /
Insurance.
SLIDE 37 What has been done?
- Bossier Parish and Bossier City have enacted
legislation which allows use of established HWM’s to regulate future developments on land located between the levee system and the Red River.
- Caddo Parish and the City of Shreveport have
adopted a voluntary policy that recommends the use of high water marks for development
- n land between the levee and the Red River.
SLIDE 38 What Should be Done to Protect Lives and Property?
- Local public agencies should use the HWM’s to
regulate development on land located between Caddo and Bossier levee systems.
- Local public agencies should establish legislation
that will allow preservation of open space for flood plain storage protection.
- Local public agencies should establish legislation
that mandates mitigation (Flood Plain Compensation) for development authorized on land located between the levee systems on both sides of the river.
SLIDE 39 Options for Investigation
- Raise Levees
- Operation of L&D 5
- Operation of Flood Control Reservoirs
- Determine B/C of Removing Enough
Vegetation & Silt to Impact River Crests
- Investigate Diversions Above Shreveport
- Buy Out Property Between Levees and Revert
Back to Flood Storage
- Monitor Siltation & Urbanization and Prepare
for Increased Risk of Flooding
SLIDE 40
Thank You
Richard Brontoli Red River Valley Association (318) 221-5233 rrva@rrva.org www.rrva.org