real time weather radar data processing for urban
play

REAL TIME WEATHER RADAR DATA PROCESSING FOR URBAN HYDROLOGY IN NANCY - PDF document

Presented to XXII General Assembly of the EGS, 21-25 April 1997, Vienna/Austria. Publicised in Physics and Chemistry of the Earth (B), Vol. 24, No 8, pp.909-914, 1999 REAL TIME WEATHER RADAR DATA PROCESSING FOR URBAN HYDROLOGY IN NANCY FAURE


  1. Presented to XXII General Assembly of the EGS, 21-25 April 1997, Vienna/Austria. Publicised in Physics and Chemistry of the Earth (B), Vol. 24, No 8, pp.909-914, 1999 REAL TIME WEATHER RADAR DATA PROCESSING FOR URBAN HYDROLOGY IN NANCY FAURE Dominique, International Water Centre*, AUCHET Pierre, Greater Nancy Urban Community** * NANC.I.E., 149 rue Gabriel Péri, B.P. 290, F54515 VANDOEUVRE LES NANCY, FRANCE ** Communauté Urbaine du Grand Nancy, 22 - 24 Viaduc Kennedy, C.O. 36, F54035 NANCY, FRANCE tool in evaluating the spatial structure of the rain areas Abstract. A real time weather radar data processing system and in anticipating the very short-term evolution of has been under development in Nancy since 1994. This precipitation over the City and it's suburbs. evolutionary system is operational and radar data are used to improve the management of the sewer system of the urban community in accordance with two objectives : protection against flooding and reduction of pollution overflows. The 2 Description of the real time process developed first part of this paper presents the real time processing Since 1994, a real time weather radar data processing has carried out directly by the computer which receives radar been developed in accordance with the requirements of the data every five minutes. This processing includes verifying operational department in charge of sewage system
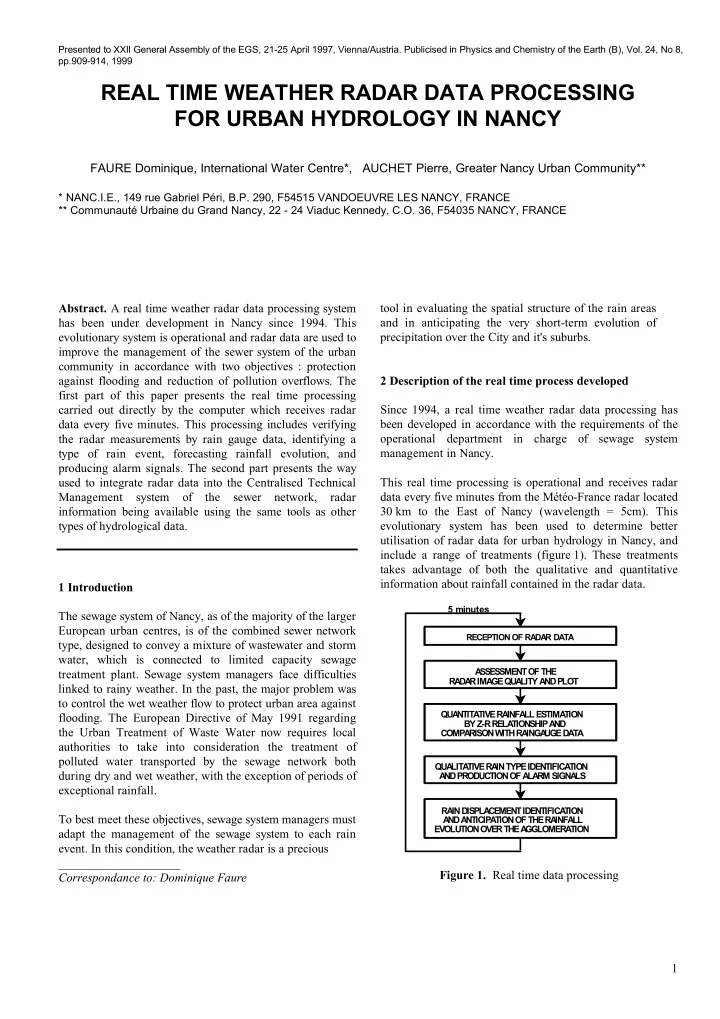
 the radar measurements by rain gauge data, identifying a management in Nancy. type of rain event, forecasting rainfall evolution, and producing alarm signals. The second part presents the way This real time processing is operational and receives radar used to integrate radar data into the Centralised Technical data every five minutes from the Météo-France radar located Management system of the sewer network, radar 30 km to the East of Nancy (wavelength = 5cm). This information being available using the same tools as other evolutionary system has been used to determine better types of hydrological data. utilisation of radar data for urban hydrology in Nancy, and include a range of treatments (figure 1). These treatments takes advantage of both the qualitative and quantitative information about rainfall contained in the radar data. 1 Introduction 5 minutes The sewage system of Nancy, as of the majority of the larger European urban centres, is of the combined sewer network RECEPTION OF RA DA R DA TA type, designed to convey a mixture of wastewater and storm water, which is connected to limited capacity sewage A SSESSMENT OF THE treatment plant. Sewage system managers face difficulties RA DA R IMA GE QUA LITY A ND PLOT linked to rainy weather. In the past, the major problem was to control the wet weather flow to protect urban area against QUA NTITA TIVE RA INFA LL ESTIMA TION flooding. The European Directive of May 1991 regarding BY Z-R RELA TIONSHIP A ND the Urban Treatment of Waste Water now requires local COMPA RISON W ITH RA INGA UGE DA TA authorities to take into consideration the treatment of polluted water transported by the sewage network both QUA LITA TIVE RA IN TYPE IDENTIFICA TION during dry and wet weather, with the exception of periods of A ND PRODUCTION OF A LA RM SIGNA LS exceptional rainfall. RA IN DISPLA CEMENT IDENTIFICA TION To best meet these objectives, sewage system managers must A ND A NTICIPA TION OF THE RA INFA LL EVOLUTION OVER THE A GGLOMERA TION adapt the management of the sewage system to each rain event. In this condition, the weather radar is a precious ____________________ Figure 1. Real time data processing Correspondance to: Dominique Faure 1

  2. Presented to XXII General Assembly of the EGS, 21-25 April 1997, Vienna/Austria. Publicised in Physics and Chemistry of the Earth (B), Vol. 24, No 8, pp.909-914, 1999 NANCY Figure 2. Example of operational display for the comparison between areal rainfall values estimated from radar and gauge data (12 gauges network). In this example, a significant bias is bring out for the last hour. 2.1 Assessment of the radar image quality and plot Faure et al, 1996 : rainfall values and confidence intervals are estimated on line by kriging data recorded by a 12 The first stage of treatment is intended to assess the quality gauges network. These confidence intervals take into of the radar image recorded and involves for each image : account uncertainties about rain gauge measurement of a - verifying that the radar data has been correctly received, rainfall field and allow to estimate confidence intervals for - detecting transmission errors, the values of criteria used for the gauge/radar comparisons. - assessing the amount of ground clutter partly filtered by This method makes radar and rain gauge data more the Météo-France procedure, coherent, and realises a more objective comparison - selecting the most interesting images for automatic between these very different sources of data, bringing out saving in accordance with various criteria, in order to the really significant bias (Faure et al, 1994). create a data bank, - plotting the radar image with a zoom on the territory of Figure 2 shows an example of the operational display for the Nancy Urban Community. the comparisons. Lower left image plots the latest radar image received. Upper left graph shows the evolution of areal rainfall estimated over the 130 km² area for the last 2.2 Exploitation of quantitative information : rainfall 250 minutes, with an accumulation period of 5 minutes for estimation and validation radar rainfalls and of 1 minute for gauge rainfalls. Upper right graph indicates the ratios between radar and gauge The second stage of treatment involves estimating and rainfalls for accumulation periods of 5 minutes, with two validating rainfall rates, as well as estimating areal confidence intervals (CI=80% and CI=90%). Only gauge rainfalls over urban catchment areas. Rainfall rates are rainfall values above a threshold of 1 mm/h are considered. estimated from radar data by a previously selected Z-R A bias value is proposed if the confidence intervals not relationship (by default, the Marshall-Palmer Z-R include the ratio value 1 (indicated by the horizontal dark relationship). These estimations are validated by line). Lower right graph indicates the evolution of the sum comparison between areal rainfall values calculated from of areal rainfalls cumulated from the beginning of the rain radar and gauge data over the centre of the Nancy Urban event. Beginning and ending of a rain event are defined by Community's territory (130 km² area). Areal rainfall values an hourly period corresponding to cumulated gauge estimated from gauge measurements are not absolute rainfalls below 0.1 mm. Sum of the gauge areal rainfalls is references but values with confidence intervals estimated plotted with tree confidence intervals (CI=80%, 99.7%, by a geostatistical approach described in 99.999%). 2

Download Presentation
Download Policy: The content available on the website is offered to you 'AS IS' for your personal information and use only. It cannot be commercialized, licensed, or distributed on other websites without prior consent from the author. To download a presentation, simply click this link. If you encounter any difficulties during the download process, it's possible that the publisher has removed the file from their server.

Recommend


More recommend