reading why do visualization
play

Reading Why Do Visualization? CPSC 314 Computer Graphics FCG Chap - PowerPoint PPT Presentation

University of British Columbia Reading Why Do Visualization? CPSC 314 Computer Graphics FCG Chap 27 pictures help us think Jan-Apr 2013 substitute perception for cognition N/A 2nd edition, available online at external memory:


  1. University of British Columbia Reading Why Do Visualization? CPSC 314 Computer Graphics • FCG Chap 27 • pictures help us think Jan-Apr 2013 • substitute perception for cognition • N/A 2nd edition, available online at • external memory: free up limited cognitive/memory resources for Tamara Munzner higher-level problems http://www.cs.ubc.ca/labs/imager/tr/2009/VisChapter Nonspatial/Information Visualization Visualization 
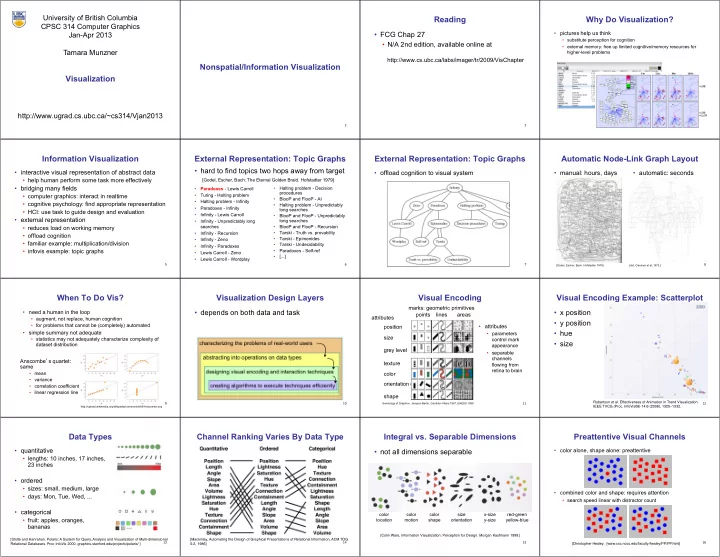
http://www.ugrad.cs.ubc.ca/~cs314/Vjan2013 2 3 4 Information Visualization External Representation: Topic Graphs External Representation: Topic Graphs Automatic Node-Link Graph Layout • hard to find topics two hops away from target • interactive visual representation of abstract data • offload cognition to visual system • manual: hours, days • automatic: seconds • help human perform some task more effectively [Godel, Escher, Bach: The Eternal Golden Braid. Hofstadter 1979] • bridging many fields • Paradoxes - Lewis Carroll • Halting problem - Decision procedures • Turing - Halting problem • computer graphics: interact in realtime • BlooP and FlooP - AI • Halting problem - Infinity • cognitive psychology: find appropriate representation • Halting problem - Unpredictably • Paradoxes - Infinity long searches • HCI: use task to guide design and evaluation • Infinity - Lewis Carroll • BlooP and FlooP - Unpredictably • external representation • Infinity - Unpredictably long long searches searches • BlooP and FlooP - Recursion • reduces load on working memory • Infinity - Recursion • Tarski - Truth vs. provability • offload cognition • Tarski - Epimenides • Infinity - Zeno • familiar example: multiplication/division • Tarski - Undecidability • Infinity - Paradoxes • infovis example: topic graphs • Paradoxes - Self-ref • Lewis Carroll - Zeno • [...] • Lewis Carroll - Wordplay 5 6 7 8 [Godel, Escher, Bach. Hofstadter 1979] [dot, Gansner et al, 1973.] When To Do Vis? Visualization Design Layers Visual Encoding Visual Encoding Example: Scatterplot marks: geometric primitives • depends on both data and task • x position • need a human in the loop points lines areas attributes • augment, not replace, human cognition • y position • for problems that cannot be (completely) automated • attributes position • simple summary not adequate • hue • parameters size • statistics may not adequately characterize complexity of control mark • size dataset distribution appearance grey level • separable channels Anscombe ’ s quartet: texture flowing from same retina to brain • mean color • variance orientation • correlation coefficient • linear regression line shape Robertson et al. Effectiveness of Animation in Trend Visualization. 9 10 Semiology of Graphics. Jacques Bertin, Gauthier-Villars 1967, EHESS 1998 11 12 IEEE TVCG (Proc. InfoVis08) 14:6 (2008), 1325 - 1332. http://upload.wikimedia.org/wikipedia/commons/b/b6/Anscombe.svg Data Types Channel Ranking Varies By Data Type Integral vs. Separable Dimensions Preattentive Visual Channels • quantitative • not all dimensions separable • color alone, shape alone: preattentive • lengths: 10 inches, 17 inches, 23 inches • ordered • sizes: small, medium, large • combined color and shape: requires attention • days: Mon, Tue, Wed, ... • search speed linear with distractor count • categorical color color color size x-size red-green • fruit: apples, oranges, location motion shape orientation y-size yellow-blue bananas [Colin Ware, Information Visualization: Perception for Design. Morgan Kaufmann 1999.] [Stolte and Hanrahan. Polaris: A System for Query, Analysis and Visualization of Multi-dimensional [Mackinlay, Automating the Design of Graphical Presentations of Relational Information, ACM TOG [Christopher Healey, [www.csc.ncsu.edu/faculty/healey/PP/PP.html] 13 14 15 16 Relational Databases. Proc InfoVis 2000. graphics.stanford.edu/projects/polaris/ ] � 5:2, 1986] �

  2. Preattentive Visual Channels Coloring Categorical Data Coloring Categorical Data Quantitative Colormaps • preattentive channels include • 22 colors, but only ~8 distinguishable • discrete small patches separated in space • dangers of rainbows • hue • perceptually nonlinear • limited distinguishability: around 8-14 • shape • arbitrary not innate ordering • texture • channel dynamic range low • other approaches • length • width • explicitly segmented colormaps • best to choose bins explicitly • size • monotonically increasing/(decreasing) luminance, • maximal saturation for small areas • orientation plus hue to semantically distinguish regions • curvature • intersection • intensity • flicker • direction of motion • stereoscopic depth [Healey, [www.csc.ncsu.edu/faculty/healey/PP/PP.html] • lighting direction [Colin Ware, Information Visualization: Perception for Design. Morgan Kaufmann 1999.] • many more... Rogowitz and Treinish. Data Visualization: The End of the Rainbow. IEEE Spectrum 17 18 19 20 35(12):52-59, Dec 1998. � [www.peacockmaps.com, research.lumeta.com/ches/map] � 3D vs 2D Representations Space vs Time: Showing Change Space vs Time: Showing Change Composite Views • curve comparison difficult: perspective distortion, occlusion • animation: show time using temporal change • small multiples: show time using space • pixel-oriented views • superimposing/layering • dataset is abstract, not inherently spatial • overview: show each time step in array • overviews with high • shared coordinate frame • good: show process • after data transformation to clusters, linked 2D views of information density • compare: side by side easier than temporal • redundant visual representative curves show more • good: flip between two things encoding • external cognition vs internal memory • bad: flip between between many things • general technique, not just for temporal changes • interference between intermediate frames [Outside In excerpt. www.geom.uiuc.edu/docs/outreach/oi/evert.mpg] � [Jones, Harrold, and Stasko. Visualization of [van Wijk and van Selow, Cluster and Calendar based Visualization of Time Series Data, InfoVis99 � [Munzner. Interactive Visualization of Large 21 [www.astroshow.com/ccdpho/pluto.gif] � 22 [Edward Tufte. The Visual Display of Quantitative Information, p 172] � 23 Test Information to Assist Fault Localization. 24 Graphs and Networks. Stanford CS, 2000] � [Edward Tufte. The Visual Display of Quantitative Information, p 172] � Proc. ICSE 2002, p 467-477.] � Composite Views: Glyphs Adjacent: Multiple Views Adjacent Views Data Reduction • overviews as aggregation • different visual encodings show different aspects of the data • internal structure where subregions have different • overview and detail • focus+context • linked highlighting to show where contiguous in one view visual channel encodings • same visual encoding, different resolutions distributed within another • show details embedded within context • small multiples • distortion: TreeJuxtaposer video • same visual encoding, different data • filtering: SpaceTree demo [Ward. A Taxonomy of Glyph Placement Strategies for Multidimensional Data Visualization. Information Visualization Journal 1:3-4 (2002), 194--210.] � [Munzner et al. TreeJuxtaposer: Scalable Tree Comparison [Plaisant, Grosjean, and Bederson. SpaceTree: Supporting [Smith, Grinstein, and Bergeron. Interactive data exploration with a using Focus+Context with Guaranteed Visibility. Proc Exploration in Large Node Link Tree, Design Evolution and supercomputer. Proc. IEEE Visualization, p 248-254, 1991.] 25 [Weaver. http://www.personal.psu.edu/cew15/improvise/examples/census] 26 27 28 SIGGRAPH 2003, p 453-462] � Empirical Evaluation. Proc. InfoVis 2002 � � � Dimensionality Reduction DR Example: Image Database DR Technique: MDS Parallel Coordinates • 4096 D (pixels) to 2D (hand gesture) • mapping from high-dimensional space into space of • only two orthogonal axes in the plane • multidimensional scaling • no semantics of new synthetic dimensions from alg. fewer dimensions • minimize differences between interpoint distances in • instead, use parallel axes! • assigned by humans after inspecting results • generate new synthetic dimensions high and low dimensions finger extension • minimize objective function: stress • why is lower-dimensional approximation useful? • assume true/intrinsic dimensionality of dataset is (much) lower than measured dimensionality! • only indirect measurement possible? • fisheries: want spawn rates. D: matrix of lowD distances have water color, air temp, catch rates... Δ : matrix of hiD distances • sparse data in verbose space? • documents: word occurrence vectors. [Ingram, Munzner, Olano. Glimmer: 10K+ dimensions, want dozens of topic clusters • Glimmer: MDS on the GPU [Hyperdimensional Data Analysis Using Parallel Coordinates. Edward J. Wegman. Journal of the American Multiscale MDS on the GPU. IEEE TVCG wrist rotation Statistical Association, Vol. 85, No. 411. (Sep., 1990), pp. 664-675.] 15(2):249-261, 2009. � � 29 29 30 31 32 [A Global Geometric Framework for Nonlinear Dimensionality Reduction. Tenenbaum, de Silva and Langford. Science 290 (5500): 2319-2323, 2000, isomap.stanford.edu]

Download Presentation
Download Policy: The content available on the website is offered to you 'AS IS' for your personal information and use only. It cannot be commercialized, licensed, or distributed on other websites without prior consent from the author. To download a presentation, simply click this link. If you encounter any difficulties during the download process, it's possible that the publisher has removed the file from their server.

Recommend


More recommend