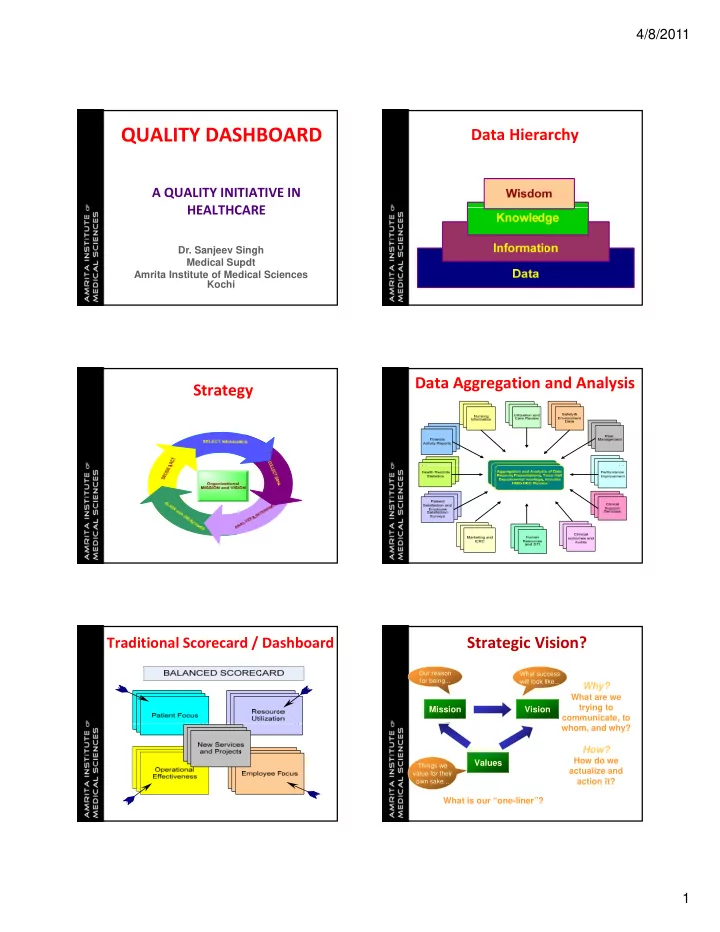
quality dashboard
play

QUALITY DASHBOARD Data Hierarchy A QUALITY INITIATIVE IN HEALTHCARE - PDF document

4/8/2011 QUALITY DASHBOARD Data Hierarchy A QUALITY INITIATIVE IN HEALTHCARE HEALTHCARE Dr. Sanjeev Singh Medical Supdt Amrita Institute of Medical Sciences Kochi Data Aggregation and Analysis Strategy Strategic Vision? Traditional Scorecard


  1. 4/8/2011 QUALITY DASHBOARD Data Hierarchy A QUALITY INITIATIVE IN HEALTHCARE HEALTHCARE Dr. Sanjeev Singh Medical Supdt Amrita Institute of Medical Sciences Kochi Data Aggregation and Analysis Strategy Strategic Vision? Traditional Scorecard / Dashboard Our reason What success for being... will look like... Why? What are we trying to Mission Vision communicate, to whom, and why? How? How do we Values Things we actualize and value for their own sake... action it? What is our “one-liner”? 1

  2. 4/8/2011 Strategic Planning Process The Measures A simple balanced Hard and Soft view of the organization’s Leading and Lagging progress p g towards its Strategic Alignment objectives “If you can’t measure it, you can’t manage it” Kaplan and Norton 1996 Leading and Lagging Indicators Quality Dashboard Planning Process Vision What are the steps we will Mission be taking to achieve our vision of Lagging Leading the future? Hard Soft Objectives Objective Subjective j Outcome Learning and Growth Measures Control Leadership Stability Change Tactical Strategic Targets What will progress Bottom up measures Top down measures towards out vision Progress of the future look like? Quality Dashboard Measuring for Excellence Excellence in Healthcare is achieved by: Focus on Customer and Community D i Driven by Employees b E l Leadership in technology Practice of world class Safety Inspired by Innovation Organizational Growth 2

  3. 4/8/2011 Six perspectives The six perspectives Measures linked to perspectives List of Measures by Perspective List of Measures by Perspective List of Measures by Perspective 3

  4. 4/8/2011 Traffic Light Format Determining Measures Measure causes, not effects Look for trends, patterns and structures, not events Introduce new measures each time you y introduce new goals! The measurements must reflect the strategy! Develop composite measures if necessary Implementation Process The Strategic Planning Cycle Decide on a what you want your organization to be Initiation Design Level 0 Scorecard Design Unit Scorecards Convert that vision into Decide on Targets measurable objectives Design and Construct and targets and targets C ll Collection and Reporting System ti d R ti S t Integrate into Strategic Planning Craft a strategy to achieve Process the desired results Communication & Training Complete full implementation Implement it effectively 2m and efficiently Evaluate performance and 2y take corrective actions Performance Management Best Practice Quality Dashboard Kill Flawed Metrics M Measure Frequently F tl Performance Management Keep It Simple Strategic Balanced Achieve Plan Scorecard Objectives Get on With It 4

  5. 4/8/2011 Evolution of Quality Dashboard Thank you sanjeevksingh@aims amrita edu sanjeevksingh@aims.amrita.edu 5

Download Presentation
Download Policy: The content available on the website is offered to you 'AS IS' for your personal information and use only. It cannot be commercialized, licensed, or distributed on other websites without prior consent from the author. To download a presentation, simply click this link. If you encounter any difficulties during the download process, it's possible that the publisher has removed the file from their server.

Recommend


More recommend