
SLIDE 1
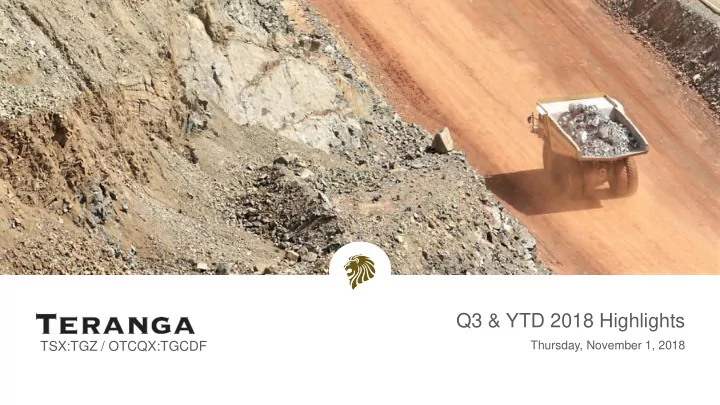
Q3 & YTD 2018 Highlights
Thursday, November 1, 2018
TSX:TGZ / OTCQX:TGCDF
Q3 & YTD 2018 Highlights TSX:TGZ / OTCQX:TGCDF Thursday, - - PowerPoint PPT Presentation
Q3 & YTD 2018 Highlights TSX:TGZ / OTCQX:TGCDF Thursday, November 1, 2018 Forward-Looking Statements All information included in this presentation, including any information as to Terangas future financial or operating performance and other
Thursday, November 1, 2018
TSX:TGZ / OTCQX:TGCDF
2
All information included in this presentation, including any information as to Teranga’s future financial or operating performance and other statements that express management’s expectations or estimates of future performance, other than statements of historical fact, constitute forward-looking information or forward-looking statements within the meaning of applicable securities laws and are based on expectations, estimates and projections as of the date hereof. Forward-looking statements are included for the purpose of providing information about management’s current expectations and plans relating to the future. Wherever possible, words such as “plans”, “expects”, “scheduled”, “trends”, “indications”, “potential”, “estimates”, “predicts”, “anticipate”, “to establish”, “believe”, “intend”, “ability to”, or statements that certain actions, events or results “may”, “could”, “would”, “might”, “will”, or are "likely" to be taken, occur or be achieved, or the negative of these words or other variations thereof, have been used to identify such forward-looking information. Specific forward-looking statements include, without limitation, all disclosure regarding future results of operations, economic conditions and anticipated courses of action. Although the forward-looking statements contained herein reflect management's current beliefs and reasonable assumptions based upon information available to management as
conditions, anticipated future estimates of free cash flow, and courses of action. Teranga cautions you not to place undue reliance upon any such forward-looking statements. The risks and uncertainties that may affect forward-looking statements include, among others, the inherent risks involved in exploration and development of mineral properties, including government approvals and permitting, changes in economic conditions, changes in the worldwide price of gold and other key inputs, changes in mine plans and other factors, such as project execution delays, many of which are beyond the control of Teranga. For a more comprehensive discussion of the risks faced by Teranga, and which may cause the actual financial results, performance or achievements of Teranga to be materially different from estimated future results, performance or achievements expressed or implied by forward-looking information or forward-looking statements, please refer to Teranga’s latest Annual Information Form filed with Canadian securities regulatory authorities at www.sedar.com or on Teranga’s website at www.terangagold.com. The risks described in the Annual Information Form (filed and viewable on www.sedar.com and on Teranga’s website at www.terangagold.com) are hereby incorporated by reference herein. Teranga disclaims any intention or obligation to update or revise any forward-looking statements whether as a result of new information, future events or otherwise, except as required by applicable law. Nothing herein should be construed as either an offer to sell
All references to Teranga include its subsidiaries unless the context requires otherwise. This presentation contains references to Teranga using the words “we”, “us”, “our” and similar words and the reader is referred to using the words “you”, “your” and similar words. All dollar amounts stated are denominated in U.S. dollars unless specified otherwise.
President & CEO
Encouraging exploration updates Acquired the remaining interest in Golden Hill Entered into earn-in agreement with ACC Funding secured to advance project to feasibility study On track for initial resource estimate in early 2019
Good progress advancing Miminvest properties, particularly Guitry and Dianra Commenced technical work at Afema
Construction advancing on schedule in line with latest capital spend estimates Increased gold reserves by 450,000 oz Mine life extended to 13 years and improved 5-year financial and operating profile Filed updated NI 43-101 Technical Report
Record Q3 production of 56,376 oz Record YTD production of 185,788 oz Increased production guidance to 235koz - 240koz
4
Chief Operating Officer
50,873 56,376 Q3 2017 Q3 2018
Production
(oz Au)
233,267 FY2017 Updated 2018 Outlook
FY 2018 Production Guidance 235,000 – 240,000 oz(1)(2)
6
165,333 185,788 YTD 2017 YTD 2018
Refer to Appendix – Endnotes (1) and (2)
Grade Mined NI 43-101 Mine Plan(8) Projected Year-end 2018 3.14g/t ~3.5g/t
7 Refer to Appendix – Endnote (8)
8
$11.34 $12.82
YTD 2017 YTD 2018
$2.31 $2.70
YTD 2017 YTD 2018
Mining Costs
($/t mined)
Total Cash Costs*
($/oz Au) $735 $650
YTD 2017 YTD 2018 2018 Guidance: $700-$750
$2.46 $2.49
Q3 2017 Q3 2018
$782 $663
Q3 2017 Q3 2018 2018 Guidance: $11.00-$12.50
Milling Costs
($/t milled) $10.46 $14.06
Q3 2017 Q3 2018 2018 Guidance: $2.25-$2.50 *Refer to Appendix – Non-IFRS Performance Measures
9
Wahgnion Process Plant October 2018
Life of Mine Summary(5)(6)(7) Initial 5 years LOM (13 years) Annual production 132koz 114koz All-in sustaining costs* $761/oz $904/oz Total free cash flow* $311M $479M Pre-production capital** ($240M) Pre-production operating costs ($28M) Net cash flow $211M
2P Reserves(3)
M&I Resources(4)
Mine Life(5)
*Refer to Appendix – Non-IFRS Performance Measures **Pre-production capital costs of $240 million excludes $16 million in construction readiness activities spent prior to major construction Refer to Appendix – Endnotes (3), (4), (5), (6) and (7)
NI 43-101 Technical Report Filed October 31, 2018
Wahgnion Mine License
10
11 For full details on Golden Hill, please visit www.terangagold.com
GEOLOGY
Tarkwaian Type Sediments Volcano Sediments Mixed Volcano Sediments & Volcanics Basalt Grantoid Batholith
Ma North Ma Main Ma East Jackhammer Hill Peksou C-Zone B-Zone A-Zone Nahiri
Q3 2018 Core Drilling Activity
Peksou North Nahiri Plateau
Peksou 4 holes 494 metres Jackhammer Hill 30 holes 4,416 metres C-Zone 17 holes 2,116 metres Ma North 35 holes 4,301 metres Q3 TOTAL 99 holes 12,955 metres YTD TOTAL 254 holes 31,456 metres Q3 2018 Reverse Circulation Drilling Activity Ma Main 19 holes 1,862 metres Jackhammer Hill 15 holes 1,175 metres Ma North 4 holes 360 metres Q3 TOTAL 38 holes 3,397 metres YTD TOTAL 38 holes 3,397 metres Golden Hill (Burkina Faso, West Africa)
12
Miminvest Exploration Properties
Highly prospective with potential to be comprehensive district
favourable follow-up targets Afema Mine Joint Venture
large land package (includes mine license)
regional land package with a combined strike length exceeding 140 km
Côte d'Ivoire 35% Burkina Faso 21% Ghana 19% Guinea 11% Mali 10% Other 4%
Endeavour Endeavour Perseus Randgold
Guitry
Tiassale Mahepleu
Sangaredougou
Newcrest
Dianra Afema
Côte d’Ivoire represents more than one-third of the West African Birimian Greenstone Belt Operating Gold Mine/ Development Project
Chief Financial Officer
Revenue ($ millions)
Three months ended September 30 Nine months ended September 30 2018 2017 % Change Per ounce 2018 2017 % Change $1,209 $1,277 (5%) Average realized gold price* $1,284 $1,253 2% $1,213 $1,278 (5%) Average spot gold price $1,282 $1,251 3% $1,178 $1,211 (3%) Low $1,178 $1,151 2% $1,262 $1,346 (6%) High $1,355 $1,346 1%
*Refer to Appendix – Non-IFRS Performance Measures
$203.4 $236.5
YTD 2017 YTD 2018
16%
Increase
14
$61.0 $64.2
Q3 2017 Q3 2018
Revenue ($ millions)
5%
Increase
15 (Per Ounce)
2018 2017 2018 2017 2018 Guidance Cost of sales $977 $1,032 $928 $974 $950 – $1,025 Total cash costs* $663 $782 $650 $735 $700 - $750 All-in sustaining costs* $1,102 $1,092 $972 $1,061 $1,000 – $1,075 Non-cash/cash inventory movements and amortized advanced royalty costs ($50) ($8) ($52) ($83) ($50) All-in sustaining costs (excluding (non-cash)/cash inventory movements and amortized advanced royalty costs)* $1,052 $1,084 $920 $978 $950 – $1,025
*Refer to Appendix – Non-IFRS Performance Measures
Q3 YTD
16
$23.0 $30.0 Q3 2017 Q3 2018
EBITDA*
($ millions)
*Refer to Appendix – Non-IFRS Performance Measures
$68.7 $99.3 YTD 2017 YTD 2018
Gross Profit
($ millions) $11.8 $12.5 Q3 2017 Q3 2018 $45.4 $65.3 YTD 2017 YTD 2018
45%
Increase
44%
Increase
31%
Increase
6%
Increase
17
Net Profit Attributable to Shareholders
($ millions) $5.2 $0.7 Q3 2017 Q3 2018
Earnings per Share (basic)
$0.05 $0.01 Q3 2017 Q3 2018
Adjusted Net Profit Attributable to Shareholders*
($ millions)
Adjusted Earnings per Share* (basic)
$10.4 $7.9 Q3 2017 Q3 2018 $0.10 $0.07 Q3 2017 Q3 2018
*Refer to Appendix – Non-IFRS Performance Measures
86%
Decrease
86%
Decrease
24%
Decrease
Adjusting for items not reflective of underlying performance 1. $8.6M in realized gains on gold forward sales contracts 2. $1.8M in other non-cash fair-value changes Partially offset by 1. $2.6M non-cash accretion expense 2. $0.7M in foreign exchange impacts
24%
Decrease
18
Net Profit Attributable to Shareholders
($ millions) $21.4 $16.8 YTD 2017 YTD 2018
Earnings per Share (basic)
$0.20 $0.16 YTD 2017 YTD 2018
Adjusted Net Profit Attributable to Shareholders*
($ millions)
Adjusted Earnings per Share* (basic)
$26.2 $22.4 YTD 2017 YTD 2018 $0.24 $0.21 YTD 2017 YTD 2018
*Refer to Appendix – Non-IFRS Performance Measures
14%
Decrease
14%
Decrease
21%
Decrease
21%
Decrease
Adjusting for items not reflective of underlying performance 1. $16.4M in realized gains on gold forward sales contracts 2. $1.8M in other non-cash fair-value changes Partially offset by 1. $7.6M non-cash accretion expense 2. $2.6M in foreign exchange losses 3. $2.5M foreign exchange impact on deferred taxes
19
$10.2 $17.4 Q3 2017 Q3 2018 $11.9 $20.2 Q3 2017 Q3 2018
Cash Flows Related to Operating Activities, Before Changes in Working Capital Excluding Inventories ($ millions) Net Cash Provided by Operating Activities ($ millions)
70%
Increase
70%
Increase
May
Revolver Facility) September
October
20
1. Increased FY2018 production to 235,000 – 240,000 oz 2. Costs per ounce expected to meet the low end of range 3. Unit costs and total mine site production costs to exceed the high end of guidance 4. Wahgnion construction spend expected to meet the low end of the range
23 The technical information contained in this document relating to the Sabodala and Wahgnion open pit mineral reserve estimates is based on, and fairly represents, information compiled by Mr. Stephen Ling, P. Eng who is a member of the Professional Engineers Ontario. Mr. Ling is a full time employee of Teranga and is not "independent" within the meaning of NI 43-101. Mr. Ling has sufficient experience which is relevant to the style of mineralisation and type of deposit under consideration and to the activity which he is undertaking to qualify as a "Qualified Person" under NI 43- 101 Standards of Disclosure for Mineral Projects. Mr. Ling has consented to the inclusion in this document of the matters based on his compiled information in the form and context in which it appears in this document. The technical information contained in this document relating to mineral resource estimates is based on, and fairly represents, information compiled by Ms. Patti Nakai-Lajoie. Ms. Nakai-Lajoie, P. Geo., is a Member of the Association of Professional Geoscientists of Ontario. Ms. Nakai-Lajoie is a full time employee of Teranga and is not "independent" within the meaning of NI 43-101. Ms. Nakai-Lajoie has sufficient experience which is relevant to the style of mineralisation and type of deposit under consideration and to the activity which she is undertaking to qualify as a "Qualified Person" under NI 43-101 Standards of Disclosure for Mineral Projects. Ms. Nakai-Lajoie has consented to the inclusion in this document of the matters based on her compiled information in the form and context in which it appears in this document. The technical information contained in this document relating to the Sabodala underground ore reserves estimates is based on, and fairly represents, information compiled by Jeff Sepp, P. Eng., of Roscoe Postle Associates Inc. (“RPA”), who is a member of the Professional Engineers Ontario. Mr. Sepp is “independent” within the meaning of NI 43-101. Mr. Sepp has sufficient experience which is relevant to the style of mineralisation and type of deposit under consideration and to the activity he is undertaking to qualify as a “Qualified Person” under NI 43-101 Standards of Disclosure for Mineral Projects. Mr. Sepp has consented to the inclusion in this document of the matters based on his compiled information in the form and context in which it appears in this document. Teranga's exploration programs were managed by Peter Mann, FAusIMM. Mr. Mann was a full time employee of Teranga, during the period of this resource update and is not "independent" within the meaning of NI 43-101. Mr. Mann has sufficient experience which is relevant to the style of mineralisation and type of deposit under consideration and to the activity which he is undertaking to qualify as a “Qualified Person” as under NI 43-101 Standards of Disclosure for Mineral Projects. The technical information contained in this document relating to exploration results are based on, and fairly represents, information compiled by Mr. Mann. Mr. Mann has verified and approved the data disclosed in this release, including the sampling, analytical and test data underlying the
matters based on his compiled information in the form and context in which it appears in this document. Teranga's disclosure of mineral reserve and mineral resource information is governed by NI 43-101 under the guidelines set out in the Canadian Institute of Mining, Metallurgy and Petroleum (the "CIM") Standards on Mineral Resources and Mineral Reserves, adopted by the CIM Council, as may be amended from time to time by the CIM ("CIM Standards"). There can be no assurance that those portions of mineral resources that are not mineral reserves will ultimately be converted into mineral reserves. Teranga confirms that it is not aware of any new information or data that materially affects the information included in the technical reports for the Sabodala Project (August 30, 2017) and the Wahgnion Project (October 31, 2018) pursuant to National Instrument 43-101 - Standards of Disclosure for Mineral Projects (the “Technical Reports”), or third quarter results, market announcements and, in the case of estimates of Mineral Resources, that all material assumptions and technical parameters underpinning the estimates in the relevant market announcements concerning the Technical Reports continue to apply and have not materially changed.
24
The Company has included non-IFRS measures in this document, including “total cash costs”, “total cash costs per ounce sold”, “all-in sustaining costs” (“AISC”), “AISC (excluding cash / (non-cash) inventory movements and amortized advanced royalty costs)”, “AISC per ounce”, “AISC (excluding cash / (non-cash) inventory movements and amortized advanced royalty costs) per ounce”, “earnings before interest, taxes, depreciation and amortization” (“EBITDA”), “free cash flow”, “adjusted net profit attributable to shareholders” and “adjusted basic earnings per share”. These measures are intended to provide additional information only and do not have any standardized definition under IFRS and should not be considered in isolation or as a substitute for measures of performance prepared in accordance with IFRS. The measures are not necessarily indicative of operating profit or cash flow from
“Total cash costs” figures are calculated in accordance with a standard developed by The Gold Institute, which was a worldwide association of suppliers of gold and gold products and included leading North American gold
presented may not be comparable to other similarly titled measure of other companies. “Total cash costs per ounce sold” is a common financial performance measure in the gold mining industry but has no standard meaning under IFRS. The Company reports total cash costs on a sales basis. The World Gold Council (“WGC”) definition of AISC seeks to extend the definition of total cash costs by adding corporate general and administrative costs, reclamation and remediation costs (including accretion and amortization), exploration and study costs (capital and expensed), capitalized stripping costs and sustaining capital expenditures and represents the total costs of producing gold from current operations. AISC excludes income tax payments, interest costs, costs related to business acquisitions and items needed to normalize earnings. Consequently, this measure is not representative of all
Company’s overall profitability. The Company also expands upon the WGC definition of AISC by presenting an additional measure of “AISC (excluding cash / (non-cash) inventory movements and amortized advanced royalty costs)”. This measure excludes cash and non-cash inventory movements and amortized advanced royalty costs which management does not believe to be true cash costs and are not fully indicative of performance for the period. For Sabodala and Wahgnion, life of mine total cash costs and AISC figures used in this presentation are before cash/non-cash inventory movements and exclude any allocation of corporate overheads. Consolidated total cash costs and all-in sustaining cost figures add corporate overhead costs. “Average realized price” is a financial measure with no standard meaning under IFRS. Management uses this measure to better understand the price realized in each reporting period for gold and silver sales. Average realized price is calculated on revenue and ounces sold to all customers, except Franco-Nevada, as gold ounces sold to Franco-Nevada is recognized in revenue at 20 percent of the prevailing gold spot price on the date of delivery and 80 percent at $1,250 per ounce. The average realized price is intended to provide additional information only and does not have any standardized definition under IFRS; it should not be considered in isolation or as a substitute for measures of performance prepared in accordance with IFRS. Other companies may calculate this measure differently. “EBITDA” excludes income tax, finance costs (before accretion expense), interest income, and depreciation and amortization from net profits. EBITDA is intended to provide additional information to investors and analysts and do not have any standardized definition under IFRS and should not be considered in isolation or as a substitute for measures of performance prepared in accordance with IFRS. Management believes that EBITDA is a valuable indicator of our ability to generate liquidity by producing operating cash flow to: fund working capital needs, service debt obligations, and fund capital expenditures. “Free cash flow” is calculated as net cash flow provided by operating activities less sustaining capital expenditures. The Company believes this to be a useful indicator of our ability generate cash for growth initiatives. Starting in 2018, the Company adopted “adjusted net profit attributable to shareholders” and “adjusted basic earnings per share” as new non-IFRS financial measures. These non-IFRS financial measures are used by management and investors to measure the underlying operating performance of the Company. Presenting these measures from period to period is expected to help management and investors evaluate earnings trends more readily in comparison with results from prior periods. The Company calculates “adjusted net profit attributable to shareholders” as net profit attributable to shareholders adjusted to exclude specific items that are significant, but not reflective of the underlying operations of the Company, including: the impact of unrealized and realized foreign exchange gains and losses, gains and losses on derivative instruments, accretion expense on long-term obligations, impairment provisions and reversals thereof, and other unusual or non-recurring items. During the second quarter of 2018, the Company also excluded the impact of foreign exchange movements on deferred taxes and other non-cash fair value changes from adjusted net profit attributable to shareholders as management does not believe these factors to be reflective of the underlying performance of the Company. For more information regarding these measures, please refer to the Company’s management’s discussion and analysis accessible on the Company’s website at www.terangagold.com.
25 1. This production target is based on proven and probable reserves only from Teranga’s Sabodala Project as of June 30, 2017. For more information regarding Teranga Gold’s Mineral Reserves and Resources and related notes, please refer to the NI 43-101 compliant technical report for the Sabodala Project dated August 30, 2017 available on the Company’s website at www.terangagold.com and on SEDAR at www.sedar.com. 2. 22,500 ounces of gold production are to be sold to Franco Nevada Corporation at 20% of the spot gold price. 3. Refers to proven and probable reserves of 1.6Moz for the Wahgnion project as per reserve estimate as at May 31, 2018. For more information regarding Wahgnion’s Mineral Reserves and related notes, please refer to the press dated September 24, 2018 and the NI 43-101 compliant technical report for the Wahgnion Gold Operations date October 31, 2018, both available on the Company’s website at www.terangagold.com and SEDAR at www.sedar.com. 4. Teranga’s Wahgnion Mineral Resources estimates as at May 31, 2018. For more information regarding Wahgnion’s Mineral Resources and related notes, please refer to the press release dated June 7, 2018 and the NI 43-101 compliant technical report for the Wahgnion Gold Operations date October 31, 2018, both accessible on the Company’s website at www.terangagold.com and on SEDAR at www.sedar.com. 5. This production target is based on proven and probable ore reserves only for Teranga’s Wahgnion Project as at May 31, 2018. For more information regarding the Wahgnion’s Mineral Reserves and Resources and related notes, please refer to the press release dated September 24, 2018 and the NI 43-101 compliant technical report for the Wahgnion Gold Operations date October 31, 2018, both accessible on the Company’s website at www.terangagold.com and on SEDAR at www.sedar.com.
6. LOM assumptions include: Gold Price $1,250 per ounce Heavy Fuel Oil (HFO): Wahgnion - $0.59 per litre; Sabodala - $0.46 per litre Light Fuel Oil (LFO): Wahgnion - $1.04 per litre ($0.88 per litre during construction period); Sabodala - $0.81 per litre Euro to USD Exchange Rate: $1.10
7. Net cash flow excludes Wahgnion financing, resource development and exploration expenditures. 8. Teranga’s Sabodala Mineral Reserves and Mineral Resources estimates as at June 30, 2017. For more information regarding Sabodala’s Mineral Reserves and Resources and related notes, please refer to the NI 43-101 compliant technical report for the Sabodala Project dated August 30, 2017 accessible on the Company’s website at www.terangagold.com and on SEDAR at www.sedar.com.
Trish Moran Head of Investor Relations 77 King Street West, Suite 2110 Toronto, ON M5K 2A1 T: +1.416.607.4507 E: investor@terangagold.com W: terangagold.com
TSX:TGZ / OTCQX: TGCDF