
SLIDE 1
Q3 2017
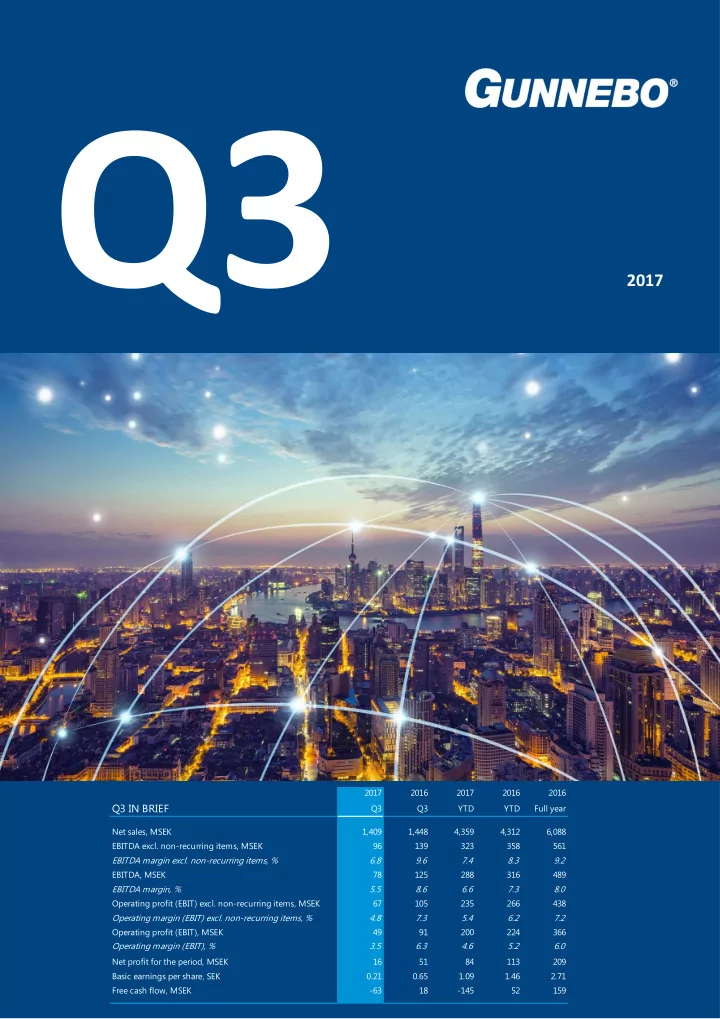
2017 2016 2017 2016 2016 Q3 IN BRIEF Q3 Q3 YTD YTD Full year Net sales, MSEK 1,409 1,448 4,359 4,312 6,088 EBITDA excl. non-recurring items, MSEK 96 139 323 358 561 EBITDA margin excl. non-recurring items, % 6.8 9.6 7.4 8.3 9.2 EBITDA, MSEK 78 125 288 316 489 EBITDA margin, % 5.5 8.6 6.6 7.3 8.0 Operating profit (EBIT) excl. non-recurring items, MSEK 67 105 235 266 438 Operating margin (EBIT) excl. non-recurring items, % 4.8 7.3 5.4 6.2 7.2 Operating profit (EBIT), MSEK 49 91 200 224 366 Operating margin (EBIT), % 3.5 6.3 4.6 5.2 6.0 Net profit for the period, MSEK 16 51 84 113 209 Basic earnings per share, SEK 0.21 0.65 1.09 1.46 2.71 Free cash flow, MSEK- 63
- 145