
SLIDE 1
PROPERTY OWNERS MEETING SEWER SERVICE CHARGE RATES
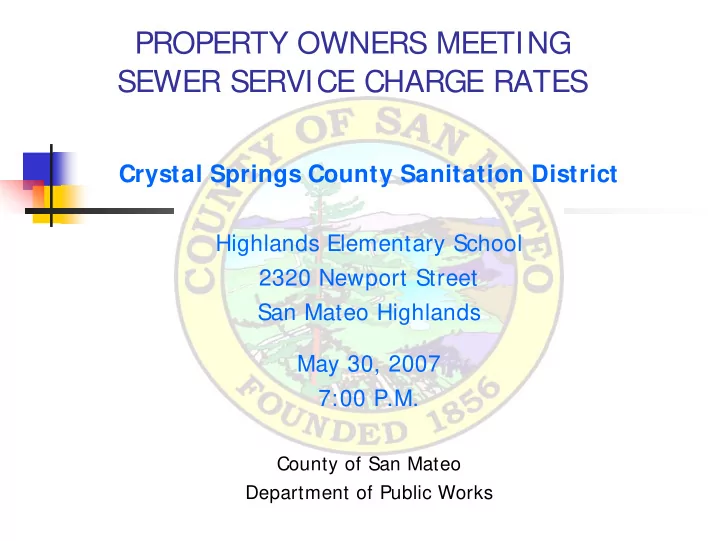
Crystal Springs County Sanitation District
Highlands Elementary School 2320 Newport Street San Mateo Highlands May 30, 2007 7:00 P.M.
County of San Mateo Department of Public Works
PROPERTY OWNERS MEETING SEWER SERVICE CHARGE RATES Crystal Springs - - PowerPoint PPT Presentation
PROPERTY OWNERS MEETING SEWER SERVICE CHARGE RATES Crystal Springs County Sanitation District Highlands Elementary School 2320 Newport Street San Mateo Highlands May 30, 2007 7:00 P.M. County of San Mateo Department of Public Works OVERVI
County of San Mateo Department of Public Works
FOSMD: Pipes ~ 81 Miles ERU – 12,597 ELHSMD:
Pipes ~ 29 Miles ERU – 1,657
CSCSD:
Pipes ~ 19 Miles ERU – 1,501
BHSMD:
Pipes ~ 7 Miles ERU - 426
DCSD:
Pipes ~ 4 Miles ERU - 293
HI SMD:
Pipes ~ 1 Mile ERU - 234
OKSMD:
Pipes ~ 2 Miles ERU - 118
KSSMD:
Pipes ~ 0.8 Miles ERU - 74
SHCSD:
Pipes ~ 2 Miles ERU - 58
ESMD:
Pipes ~ 0.3 Miles ERU - 18
Sewage Flows Through the Town of Hillsborough and City of San Mateo to the City of San Mateo’s Treatment Plant for Treatment
District Boundary San Mateo Hillsborough
property taxes within the District boundaries to fund sewer service
because it is least costly way to collect the fee
CSCSD Sample Property Tax Allocation (TRA 078-018)
Crystal Springs CSD 0.99% Bel Aire Lighting 1.54% General County Tax 17.38% Highlands Drainage 0.12% Junior High School 4.97% County Education Tax 2.59% Peninsula Hospital Dist 0.67% Highlands Recreation 10.33% Highlands Landscape 1.79% Mosquito Abatement 0.14% County Harbor District 0.26% Air Quality Mngmnt 0.15% CSA No. 1 25.59% Elementary School 18.25% High School 12.68% Free Library 2.53%
District Miles of Pipe Percentage in Easements Percentage in Streets Crystal Springs CSD 18.95 29.28% 70.72%
*Age based on District formation date ** Based on 2006-07 SSC Report
District Age (yrs)* Number of Connections** Equivalent Residential Units** Downstream Transport Agency Treatment Facility Crystal Springs CSD 60 1,429 1,501 Town of Hillsborough & City of San Mateo City of San Mateo
BURLINGAME HILLS SMD CRYSTAL SPRINGS CSD DEVONSHIRE CSD EDGEWOOD SMD EMERALD LAKE HEIGHTS SMD FAIR OAKS SMD HARBOR INDUSTRIAL SMD KENSINGTON SQUARE SMD OAK KNOLL SMD SCENIC HEIGHTS CSD UTILITIES-FLOOD CONTROL-WATERSHED PROTECTION SECTION Ann M. Stillman, Principal Civil Engineer DEPARTMENT OF PUBLIC WORKS James C. Porter, Director COUNTY MANAGER'S OFFICE SAN MATEO COUNTY BOARD OF SUPERVISORS
Image Source: Pixel-Gym
Each District Relies On Downstream Agencies To Transport The District Collected Sewage To The Treatment Plant
Crystal Springs County Sanitation District - Option 1 FY 07-08 Proposed Rate of $2,000 Per ERU
Regulations 1.6% Other Revenue (Tax Revenue & Interest) 0.9% Fund Reserve 7.4% District CIP 5.5% Out of District CIP 69.2% O&M 6.1% Treatment 9.3%
I n D i s t r i c t
Crystal Springs County Sanitation District - Option 2 FY 07-08 Proposed Rate of $1,250 Per ERU
O&M 13.8% Regulations 3.6% Other Revenue (Tax Revenue & Interest) 2.2% Fund Reserve 25.5% Out of District CIP 21.8% District CIP 12.3% Treatment 20.9%
In District
Crystal Springs County Sanitation District - Option 3 FY 07-08 Proposed Rate of $1,000 Per ERU
Other Revenue (Tax Revenue & Interest) 2.7% Regulations 4.4% Fund Reserve 23.1% Treatment 25.9% Out of District CIP 26.9% O&M 17.0%
In District
Crystal Springs County Sanitation District - Option 4 FY 07-08 Proposed Rate of $900 Per ERU
O&M 18.8% Treatment 28.6% Regulations 4.9% Other Revenue (Tax Revenue & Interest) 3.0% Fund Reserve 14.8% Out of District CIP 29.8%
I n D i s t r i c t
Crystal Springs County Sanitation District Fiscal Year 2005-06 and 2007-08 Expenditure Comparison
$- $400,000 $800,000 $1,200,000 $1,600,000 $2,000,000 $2,400,000 $2,800,000 2005-06 2007-08 (Option 1) 2007-08 (Option 2) 2007-08 (Option 3) 2007-08 (Option 4) Fiscal Year Expenditure ($)
Treatment Regulations District CIP Out of District CIP O&M
EMERGENCY RESPONSE 24 HOURS A DAY, 7 DAYS A WEEK
Image Source: City of Irving, Texas
ANTICIPATED EXPENDITURES FOR FUTURE OPERATION & MAINTENANCE BASED ON 5-YEAR HISTORICAL COSTS
GOAL TO ELIMINATE SANITARY SEWER OVERFLOWS (SSO)
What is a SSO?
Bay, and Ocean
SSO from Manhole SSO from Manhole Near Creek SSO from Cleanout
WHAT CAUSES A SSO? Blockages, breaks, and Infiltration & Inflow in the sewer pipe will cause a SSO.
WHY IS IT IMPORTANT TO ELIMINATE SSOs? UNTREATED SEWAGE IS
A THREAT TO PUBLIC HEALTH, ANIMALS, AND THE ENVIRONMENT.
WHY I S I T I MPORTANT TO ELI MI NATE SSOs? AGENCIES HAVE
BEEN LEVIED STIFF PENALTIES OR PAID LARGE SETTLEMENTS IN LAWSUITS FOR SSOs.
Notice of Violation & Intent Notice of Violation & Intent to File Suit (60 to File Suit (60-
Day Notice)
Plaintiffs Baykeeper, West County Toxic Coalition Lawyers for Clean Water Environmental Advocates vs. Defendants West County Wastewater District (WCWD) City of Richmond Veolia Water NA Downey Brand LLP
Settlement Agreement Fees Settlement Agreement Fees
WCWD/Richmond/Veolia WCWD/Richmond/Veolia
Collection System Settlement Agreement Collection System Settlement Agreement
WCWD WCWD
The San Francisco Bay Regional Water Quality Control Board imposed a $516,000 fine to the City of South San Francisco in 2006 for sewer overflows and a $626,000 administrative civil liability to the City and County of San Francisco in an impending order.
Aug 31 2006
Legal authority for permitting flows into the system, I&I control and enforcement of proper design, installation, testing standards and inspection requirements for new and rehabilitated sewers Measures and activities to maintain the wastewater collection system Design and construction standards Collection system management goals Organization of personnel, chain of command, and communications Overflow emergency response plan Fat, Oils and Grease (FOG) control program
Aug 31 2007
Capacity Management Monitoring plan for SSMP program effectiveness Periodic SSMP Audits, periodic SSMP updates, and implementation of program Communication Program
Aug 31 2008
What SSMP Elements were factored into the rates?
(CCTV) of pipes
Replacing, upgrading, or purchasing equipment for effective maintenance of sewer system
Repairing sections of pipe based on CCTV findings Repair 2% of televised pipe system per year
Regulatory Reporting and Requirements
Costs associated with required reporting and SSMP development
District CIP Identified in Sewer Master Plan
Priority # of Projects Identified Length of Pipe to be Upgraded Estimated Construction Cost Priority 1 – Capacity 1 ~ 5,000’ $1,066,852 Priority 2 –Maintenance 2 ~ 3,600’ $572,005 Priority 3 - Structural 5 ~ 10,900’ $1,737,826 Priority 3 - Structural (Video Inspection Only) 1 ~ 3,100’ $7,330
Totals
9 ~ 22,600 ft. * $3,384,013 **
District CIP Completed
Priority Number
Actual Cost Priority 1 - Capacity 1 $ 823,357
* CIP Lengths Identified Represent Approximately 22.5% of District’s Total Length of Sewer Mains (100,053 feet).
** Estimated cost includes design, administration, and inspection
Recommended and completed CIP in District:
Completed
Remaining District CIP
Priority Number of Projects Length of Pipe to be Upgraded Estimated Construction Cost Priority 2 – Maintenance 2 ~ 3,600’ $572,005 Priority 3 - Structural 5 ~ 10,900’ $1,737,826 Priority 3 - Structural (Video Inspection Only) 1 ~ 3,100’ $7,330 Totals 8 ~ 17,600 ft. * $2,317,161 **
* Remaining CIP Lengths Represent Approximately 17.5% of District’s Total Length of Sewer Mains (100,053 feet).
** Estimated cost includes design, administration, and inspection
Wet weather flow Dry weather flow
SEWAGE TREATMENT AND DISPOSAL PROCESS
Image Source: City of San Mateo
CSCSD CIP I (Polhemus Project): City of San Mateo’s share = $157,178.88 County of San Mateo’s share = $70,479.37 based on 2002-03 flow data.
CSCSD – 80.43% City of San Mateo – 14.77% County of San Mateo – 4.80% CSCSD – 46.75% City of San Mateo – 12.10% County of San Mateo – 3.94% Town of Hillsborough – 37.21% CSCSD – 4.45% City of San Mateo – 92.73% County of San Mateo – 0.24% Town of Hillsborough – 2.58%
Percentages are based on 2005-06 CSCSD Annual Report.
Project Name Total Cost CSCSD's Share 2007-08 2008-09 2009-10 2010-11 2011-12 2012-13 2013-14 2014-15 Town of Hillsborough Crystal Springs-El Cerrito Trunk, Ph II 8,600,000 $ 46.75% 3,000,000 $ 3,000,000 $ 2,600,000 $ City of San Mateo WWTP Expansion, Ph III 10,000,000 $ 4.45% 5,000,000 $ 5,000,000 $ El Cerrito Relief Sewer Line 8,000,000 $ 46.75% 1,000,000 $ 1,000,000 $ 2,000,000 $ 2,000,000 $ Force Main - Dale Ave to WWTP 6,000,000 $ WWTP Hydraulic Improvements 10,000,000 $ Total Downstream CIP (Hillsborough and San Mateo) = 42,600,000 $ 1,500,000 $ 4,000,000 $ 3,000,000 $ 15,000,000 $ 9,500,000 $ 3,600,000 $ 2,000,000 $ 2,000,000 $ 1,500,000 $ 1,000,000 $ 3,000,000 $ 6,000,000 $ 4,500,000 $ 4.45%
WWTP
Dale Ave. Pumpstation
u r l i n g a m e City of San Mateo Hillsborough S a n F r a n c isc
a y
CONSTRUCT NEW SEWERS CONSTRUCT P ARALLEL SEWERS UPSIZE SEWERS E lCerritoNewTrunk WWTP Outfall
Forcemain from Dale Ave. Pumpstation to WWTP
Dale Ave. Pumpstation
WWTP
Dale to WWTP Upgrade
*Replacement value includes construction costs only
District Replacement Value* Minimum Fund Reserve Target
Crystal Springs County Sanitation District $13,133,100 $713,000
Option 1 – Pay now (existing debt to City of San Mateo ) Option 2 – Obtain additional 15-yr loan ($1.3 Million) Option 3 – Obtain additional 15-yr loan ($1.3 Million) and no District CIP Option 4 – Lower rate, obtain additional 15-yr loan ($1.3 Million) and no District CIP
Sewer Service Charge Rate ($/Year Per Residential Unit) 2006-07 2007-08
CSCSD Option 1 – Pay now $496 $2,000 Option 2 – Obtain additional 15-yr loan $1,250 Option 3 – Obtain additional 15-yr loan and no District CIP $1,000 Option 4 – Lower rate, obtain additional 15-yr loan and no District CIP $900
Crystal Springs County Sanitation District (Option 1 & 2) Sewer Service Charge and Beginning FY Fund Reserve
$541,424 $(616,975) $866,000
$0 $250,000 $500,000 $750,000 $1,000,000 2003-04 2004-05 2005-06 2006-07 2007-08 2008-09 2009-10 2010-11 2011-12 2012-13 Fiscal Year Beginning Fund Reserve ($) $400 $600 $800 $1,000 $1,200 $1,400 $1,600 $1,800 $2,000 Sewer Service Charge Rate ($)
Min Target Fund Reserve Option 1 SSC Option 1 Fund Reserve Option 2 SSC Option 2 Fund Reserve
Crystal Springs County Sanitation District (Option 1 & 3) Sewer Service Charge and Beginning FY Fund Reserve
$541,424 $(871,439) $866,000
$0 $250,000 $500,000 $750,000 $1,000,000 2003-04 2004-05 2005-06 2006-07 2007-08 2008-09 2009-10 2010-11 2011-12 2012-13 Fiscal Year Beginning Fund Reserve ($) $400 $600 $800 $1,000 $1,200 $1,400 $1,600 $1,800 $2,000 Sewer Service Charge Rate ($)
Min Target Fund Reserve Option 1 SSC Option 1 Fund Reserve Option 3 SSC Option 3 Fund Reserve
Crystal Springs County Sanitation District (Option 1 & 4) Sewer Service Charge and Beginning FY Fund Reserve
$541,424 $(1,045,223) $866,000
$0 $250,000 $500,000 $750,000 $1,000,000 2003-04 2004-05 2005-06 2006-07 2007-08 2008-09 2009-10 2010-11 2011-12 2012-13 Fiscal Year Beginning Fund Reserve ($) $400 $600 $800 $1,000 $1,200 $1,400 $1,600 $1,800 $2,000 Sewer Service Charge Rate ($)
Min Target Fund Reserve Option 1 SSC Option 1 Fund Reserve Option 4 SSC Option 4 Fund Reserve
Key Dates Actions May 2, 2007 Sent all property owners information about sewer systems and what their sewer service charge pays for. Early/Mid May Sent all property owners information about proposed rates and timing
May 15 District staff provided Board with status update on proposed sewer service charge rates and received approval of proposed process and elements of the rates. Mid/End of May Meetings with property owners of each district to discuss the proposed rates, factors involved in establishing rates, and seek property owner input. June 5 Introduce Ordinance with proposed sewer service rates for 2007-08 through 2011-2012 fiscal years and set Public Hearing for July 24 at 9:15am. June 8 Send Prop 218 notice (45 days prior to public hearing) to property
July 24 Hold public hearing, adopt Ordinance setting rates, and adopt 2007-08 Sewer Service Charges Report based on the adopted rates.