Promoting Financial and Human Resource for Family Planning and - - PDF document

promoting financial and human resource for family
SMART_READER_LITE
LIVE PREVIEW

Promoting Financial and Human Resource for Family Planning and - - PDF document

2/3/2011 ___________________________________ Faculty of Medicine Universitas Gadjah Mada Promoting Financial and Human Resource for Family Planning and Maternal Health Ali Ghufron Mukti INTRODUCTION: HEALTHCARE PROBLEMS IN DEVELOPING


slide-1
SLIDE 1

2/3/2011 1

___________________________________

Faculty of Medicine Universitas Gadjah Mada

Promoting Financial and Human Resource for Family Planning and Maternal Health

Ali Ghufron Mukti

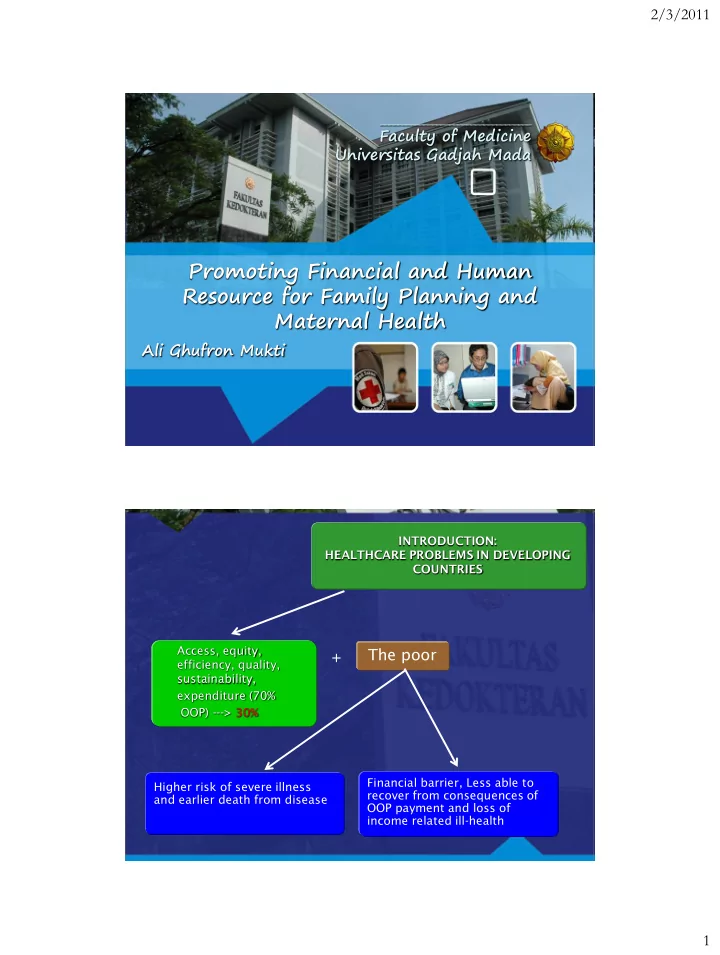
INTRODUCTION: HEALTHCARE PROBLEMS IN DEVELOPING COUNTRIES Access, equity, efficiency, quality, sustainability, expenditure (70% OOP) ---> 30% Higher risk of severe illness and earlier death from disease Financial barrier, Less able to recover from consequences of OOP payment and loss of income related ill-health

+ The poor

slide-2
SLIDE 2

2/3/2011 2

MDGs

1. Eradicate extreme poverty and hunger 2. Achieve universal primary education 3. Promote gender equality and empower women 4. Reduce child mortality 5. Improve maternal health 6. Combat HIV/AIDS, malaria and other diseases 7. Ensure environmental sustainability 8. Develop a global partnership for development

Facts of the problems

 About 1 in 5 pregnancies in the South East

Asia region end in abortion (28%). Almost 2/3

  • f abortions in the region are unsafe.

 Each year’ more than four in five women who

need care for complications of pregnancy and delivery do not receive it. The poor is worse this realte to access and the financing health care system

slide-3
SLIDE 3

2/3/2011 3

Resource Revenue Allocation or Collection Pooling Purchasing

Taxes Public Charges Mandates Grants CSR Loans Privat Insurance Communities Out-of-pocket Government Agency Private Insurance Organizations Employers Individuals and Households

Service Provision

Public health Providers Private health Providers Public Private Social Insurance or Sickness Funds Patients/Citize

Health insurance system in Indonesia: Three-tiered health insurance system

First Tier SHI

PT Askes Jamsostek

Second Tier PHI The rich, big corporation

Third Tier

MoH (Jamkesmas) and Local Government Initiatives (Jamkesda)

slide-4
SLIDE 4

2/3/2011 4

Main Characteristics of Health Financing in Indonesia, 2008

Scheme Target Population Coverage Source of fund Carriers Civil servant (SHI) Civil servant 13,5 Mln employees PT Askes pensioners Government Formal sector (SHI) formal sector 2,5 +2 Mln Employer PT Jamsostek PT Askes, PI Formal sector /MSOE Employees 1 Mln Employer Self-insured

  • f big corp

Private Insurance Jamkesmas The poor + near 76.4 Mln Tax (Central MOH Govern.Budget) Informal Sector Not covered by 20 Mln Community Local Government Jamkesmas Local Government 113.4 Mln

Out Patient Utilization Rate

  • f The Poor in 2005 and 2007

Graph 1 Health Service Utilization Rate

  • f The Poor in 2005 and 2007
  • 1,000,000

2,000,000 3,000,000 4,000,000 5,000,000 6,000,000 7,000,000 Year 2005 Year 2007 Utilization Rate

slide-5
SLIDE 5

2/3/2011 5

The impact of Jamkesmas Program on hospital admission among the poor

500000 1000000 1500000 2000000 2500000 3000000 1 2 Year 2005 2007

Yogyakarta Special Province

 Goa Garba  all pregnant women, delivery and

postnatal and newborn baby is covered

 This will be scaling p to national level

slide-6
SLIDE 6

2/3/2011 6

Maternal Mortality Rate

 2005 (421/100,000 live birth) - 228/100,000

Cambodia Indone sia Lao PDR Malaysia Philippi nes Thailand Vietnam GNI per capita, PPP$ (2008) * 1,820 3,830 2,040 13,740 3,900 5,990 2,700 GDP annual growth, % *

2000 8.8 4.9 5.8 8.9 6.0 4.8 6.8

2005 13.3 5.7 7.1 5.3 5.0 4.6 8.4

2008 5.2 6.1 7.5 4.6 3.8 2.6 6.1 Fiscal space: government tax as % of GDP * 8.2 12.3 10.1 16.6 14.3 16.8 7.2 (2006) (2004) (2007) (2003) (2006) (2007) (2007) Poverty incidence, 1$ a day, % ** 18.5 (2004) 7.5 (2002) Na 0.7 (2004) 23.0 (2008) Na 5.0 (2008) Poverty incidence, national poverty line, % ** 34.7 (2004) 20.2 (2009) 32.0 (2002) 27.0 (2008) 8.7 (2004) 32.9 (2006) 21.0 (2000) 8.5 (2007) 18.2 (2006) 13.5 (2008)

  • Source: * analysis from the World Development Indicators database, April 2009
slide-7
SLIDE 7

2/3/2011 7

Total expenditure on health (THE) as % of GDP (Gross Domestic Product) Country 1996 1997 1998 1999 2000 2001 2002 2003 2004 2005 Bangladesh 3.2 3.1 3.1 3.2 3.1 3.1 3.0 3.1 3.1 3.0 Bhutan 5.2 5.4 5.4 5.6 5.2 6.3 4.9 4.6 4.6 5.1 DPR Korea 3.1 3.2 3.5 3.5 3.6 3.5 3.5 3.5 3.5 3.5 India 4.0 4.3 4.3 4.0 4.3 4.5 4.8 4.9 5.0 5.0 Indonesia 2.2 2.1 2.3 2.3 2.3 2.7 2.8 2.9 2.8 2.7 Maldives 5.8 6.0 6.1 6.1 6.8 6.8 6.6 7.2 7.7 12.4 Myanmar 2.1 1.9 1.8 1.8 2.1 2.1 2.3 2.2 2.2 2.2 Nepal 5.3 5.2 6.4 5.8 5.2 5.3 6.0 5.6 5.6 5.7 Sri Lanka 3.6 3.5 3.7 3.7 3.8 3.9 3.9 4.1 4.3 4.2 Thailand 3.8 4.0 3.7 3.5 3.4 3.3 3.7 3.5 3.5 3.5 Timor Leste 7.8 9.5 11.2 11.7 Comparison of Total Health Expenditure on, in Several Asian Countries, 1996-2005

Asia’s Projected Total Healthcare Expenditure – 2008-2011 (US$ billions) Countries 2008 2009 2010 2011 Indonesia 12.3 13.2 14.2 15.8 Malaysia 6.5 6.9 7.5 8.2 Philippines 3.9 4.2 4.4 4.7 Singapore 5.7 6.0 6.4 6.9 Thailand 8.1 8.7 9.5 10.4 Vietnam 3.6 3.9 4.1 4.6 TOTAL 40.1 42.9 46.1 50.6

Source: Espicom Business Intelligence March 2007

New Zealand $ 13 Billions 2026- 26 Billion

slide-8
SLIDE 8

2/3/2011 8

Cambodia, 8.2% Indonesia, 12.3% Lao DPR, 10.1% Malaysia, 16.6% Philippines, 14.3% Thailand, 16.8% Vietnam, 7.2% 0% 20% 40% 60% 80% 100% 120% 0% 20% 40% 60% 80% 100% GGHE as % THE % Insurance coverage

Stride towards universal coverage, role of fiscal space Key indicators of health financing, selected countries, 2007

THE, % GDP GGH E, % THE Priv. HE, % of THE GGHE, % govern ment

expen diture

Extern al, %

  • f THE

SHI, % THE OOP, % THE THE per capita US$ THE Per capita PPP

  • int. $

Cambodia 5.9 29.0 71.0 11.2 16.4 0.0 60.1 35.8 108.1 Indonesia 2.2 54.5 45.5 6.2 1.7 8.7 30.1 41.8 81.0 Lao DPR 4.0 18.9 81.1 3.7 14.5 2.3 61.7 26.9 83.9 Malaysia 4.4 44.4 55.6 6.9 0.0 0.4 40.7 307.2 604.4 Philippines 3.9 34.7 65.3 6.7 1.3 7.7 54.7 62.6 130.2 Thailand 3.7 73.2 26.8 13.1 0.3 7.1 19.2 136.5 285.7 Viet Nam 7.1 39.3 60.7 8.7 1.6 12.7 54.8 58.3 182.7

slide-9
SLIDE 9

2/3/2011 9

  • In South Central and South East Asia, the cost of providing

family planning services to women who currently use modern methods is US$1.2 billion.

COST OF SERVICES

  • Providing modern contraceptives to all women who need

them would increase the cost of family planning services from $1.2 billion to nearly $2.1 billion annually. But it would substantially reduce the number of unintended pregnancies, thereby making improvements in maternal and newborn care more affordable.

slide-10
SLIDE 10

2/3/2011 10

  • Providing all pregnant women with the recommended

standards of maternal and newborn care would cost $4.8 billion if investments were made simultaneously in modern family planning $1.2 billion

University Academician

Development Partners Profesional Asociation

Investor Community

Government

Business-Industry

slide-11
SLIDE 11

2/3/2011 11

Human Resource in Reproductive Health Midwifery Skills

 Definition states that a skilled birth attendant is

“ an accredited health professional –such as a midwife, doctor or nurse-who has been educated and trained to proficiency in the skills needed to manage normal (uncomplicated) pregnancies, childbirth and the immediate postnatal period, and in the identification, management and referral of complications in women and newborns”

slide-12
SLIDE 12

2/3/2011 12

 SBAs are not a single cadre or professional group.  SBAs are providers with specific midwifery

competencies

Why have the critical midwifery competencies been so neglected?

 Human resources have not been paid attention to the

need for “proficiency” in the various competencies to assist women and newborn.

 Too long has been accepted that as long as the health

worker receive some or little training in midwifery was sufficient

 Lack off understanding and appreciation of what the

professional midwife can offer

 Historical prioritisation on medical training of

physicians over otehr health care providers.

slide-13
SLIDE 13

2/3/2011 13

Why Invest in midwives and

  • thers with midwifery skills?

 Has been shown to make a difference in

reducing maternal mortality in many countries

 Historical evidence tells us the countries  There is general consensus that maternal

morbidity and mortality can not be reduced without midwives and other midwifery skills, the number of these skilled providers have not significantly increased over the last two decades.

 The actual numbers has starteted to decrease as

result of migration, losses from HIV/AIDS, dissatisdfaction with remuneration and working conditions.

slide-14
SLIDE 14

2/3/2011 14

 The factor most neglected in the last decade was

human resources required to implement necessary intervention.

Framework for Rapid scale-up of midwifery providers

The framwork identifies seven interconnected areas of work, namely :

  • 1. Policy, legal and regulatory frameworks
  • 2. Ensuring equity to reach all
  • 3. Recruitment and education (pre- and in-service),accreditation,
  • 4. Empowerment, supervision and support
  • 5. Enabling environment, systems, community aspects
  • 6. Tracking progress, monitoring and evaluation, numbers and

quality

  • 7. Stewardship, resource mobilization
slide-15
SLIDE 15

2/3/2011 15

Framework for addressing issues of scaling-up midwifery for the community level

(Fauveau V et al, 2008)

Stewardship, resource mobilization

  • 1. Policy, legal and regulatory frameworks

a.

political and legislative action must forefront, it is an

  • bligation not charity
  • b. create a coalition of interested stakeholders including

professional associations to promote and influence policy changes

c.

partnerships should be built on mutual respect and include community participation

slide-16
SLIDE 16

2/3/2011 16

  • 2. Ensuring equity in reaching the poor
  • 3. Recruitment and education (pre- and in-

service), accreditation

  • 4. Empowerment, supervision and support
  • 5. Enabling environment, strengthening systems,

community aspects

  • 6. Stewardship, resource mobilization
slide-17
SLIDE 17

2/3/2011 17

Summary

 Government must provide sufficient

expenditure and proportionate investment of public resources in the maternal and child health sector and focus expenditure on rectifying existing imbalances in the provision of health facilities, health workers and health services.

 Indonesian experience in covering the poor

including mothers and newborn is really promising

 For the sake of mothers adn newborns both

scaling up coverage and skilling up quality of care are important.

slide-18
SLIDE 18

2/3/2011 18

THANK YOU Terima kasih