PROGRESSIVE DAMAGE STRUCTURAL ANALYSIS OF CARBON/EPOXY COMPOSITE - - PDF document

progressive damage structural analysis of carbon epoxy
SMART_READER_LITE
LIVE PREVIEW

PROGRESSIVE DAMAGE STRUCTURAL ANALYSIS OF CARBON/EPOXY COMPOSITE - - PDF document

18 TH INTERNATIONAL CONFERENCE ON COMPOSITE MATERIALS PROGRESSIVE DAMAGE STRUCTURAL ANALYSIS OF CARBON/EPOXY COMPOSITE LAMINATES S.G. Lee 1 *, J.H. Byun 2 , H.I. Cho 1 1 Division of Naval Architecture & Ocean Systems Engineering, Korea


slide-1
SLIDE 1

18TH INTERNATIONAL CONFERENCE ON COMPOSITE MATERIALS

  • 1. Introduction

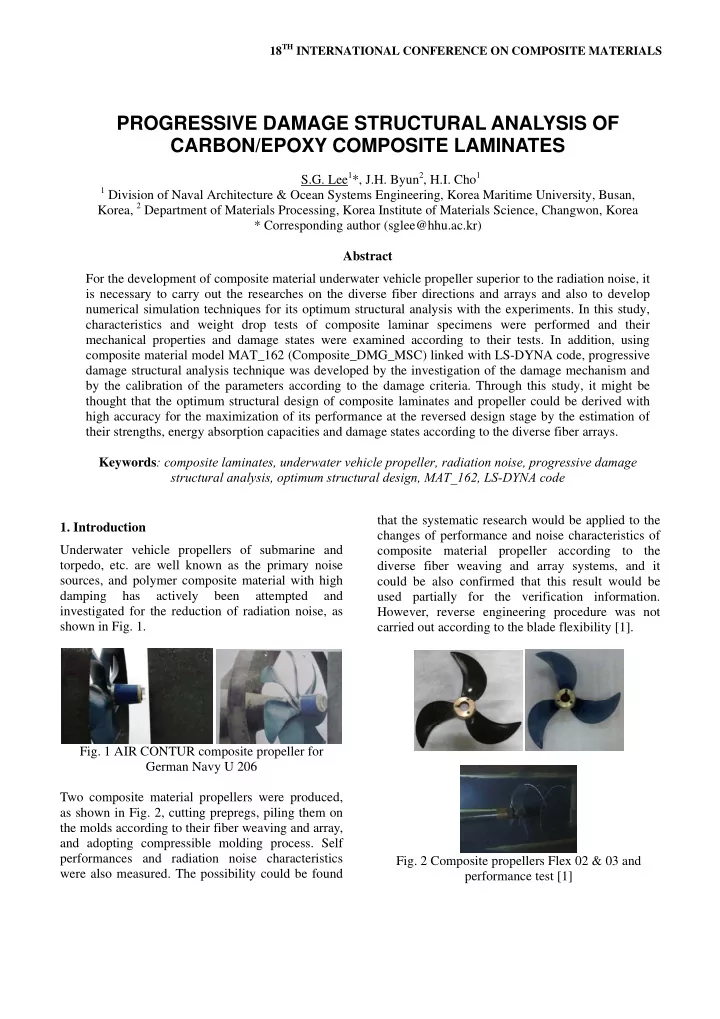
Underwater vehicle propellers of submarine and torpedo, etc. are well known as the primary noise sources, and polymer composite material with high damping has actively been attempted and investigated for the reduction of radiation noise, as shown in Fig. 1.

  • Fig. 1 AIR CONTUR composite propeller for

German Navy U 206 Two composite material propellers were produced, as shown in Fig. 2, cutting prepregs, piling them on the molds according to their fiber weaving and array, and adopting compressible molding process. Self performances and radiation noise characteristics were also measured. The possibility could be found that the systematic research would be applied to the changes of performance and noise characteristics of composite material propeller according to the diverse fiber weaving and array systems, and it could be also confirmed that this result would be used partially for the verification information. However, reverse engineering procedure was not carried out according to the blade flexibility [1].

  • Fig. 2 Composite propellers Flex 02 & 03 and

performance test [1]

PROGRESSIVE DAMAGE STRUCTURAL ANALYSIS OF CARBON/EPOXY COMPOSITE LAMINATES

S.G. Lee1*, J.H. Byun2, H.I. Cho1

1 Division of Naval Architecture & Ocean Systems Engineering, Korea Maritime University, Busan,

Korea, 2 Department of Materials Processing, Korea Institute of Materials Science, Changwon, Korea * Corresponding author (sglee@hhu.ac.kr) Abstract For the development of composite material underwater vehicle propeller superior to the radiation noise, it is necessary to carry out the researches on the diverse fiber directions and arrays and also to develop numerical simulation techniques for its optimum structural analysis with the experiments. In this study, characteristics and weight drop tests of composite laminar specimens were performed and their mechanical properties and damage states were examined according to their tests. In addition, using composite material model MAT_162 (Composite_DMG_MSC) linked with LS-DYNA code, progressive damage structural analysis technique was developed by the investigation of the damage mechanism and by the calibration of the parameters according to the damage criteria. Through this study, it might be thought that the optimum structural design of composite laminates and propeller could be derived with high accuracy for the maximization of its performance at the reversed design stage by the estimation of their strengths, energy absorption capacities and damage states according to the diverse fiber arrays. Keywords: composite laminates, underwater vehicle propeller, radiation noise, progressive damage structural analysis, optimum structural design, MAT_162, LS-DYNA code

slide-2
SLIDE 2

For the optimum structural design of composite material propeller according to the fiber direction and array of its blade, it is necessary to develop the numerical simulation technique with consideration

  • f

damage, in addition to the mechanical characteristics test and impact one of composite laminar specimens. With the advent and ongoing advances in numerical simulation capabilities and its sophisticated tools, such as highly accurate dynamic nonlinear simulation code LS-DYNA [2], structural analysis could be carried out efficiently and accurately. MAT_162 (Composite_DMG_MSC) uses damage mechanics principle for progressive damage and material degradation with failure surface, as shown in Fig. 3, based on a continuum damage mechanics (CDM). Linking MAT_162 to LS-DYNA code, the progressive damage and delamination phenomenon between layers in the composite laminate could be predicted with high accuracy through the numerical simulation compared to the experimental results, as shown in Fig. 4 [3].

  • Fig. 3 Failure surface of MAT_162 damage

mechanics model [3]

  • Fig. 4 Fiber tensile/shear failure simulation using

MAT_162 of LS-DYNA [3] In this study, numerical simulation technique using composite material model MAT_162 was developed for the optimum structural design by calibrating the material parameters and damage criteria according to characteristics test and weight drop one of composite laminar specimens. Mechanical characteristics test was carried out for the unidirection (UD) and plain weave (PW) of carbon fiber/epoxy resin laminar specimens, such as tension, compression, shear in plane (V-notch) and shear between layers (SBS; short beam strength), and also weight drop tests, for the PW laminar specimens. Their material properties, damage state and mechanism were also figured out.

  • 2. Composite Material Damage Model MAT_162

Damage model MAT_162 linked with LS-DYNA code is used for the progressive damage analysis of UD or PW composite laminates, and the behaviors

  • f fiber failure, matrix damage and delamination can

effectively be simulated under diverse loading

  • conditions. In addition to the criteria for these

damages, softening behavior after damage can be also realized. All the failure criteria are expressed in terms of stress components based on ply level strains and the associated elastic moduli. For the unidirectional model, a, b and c denote the fiber, in- plane transverse and

  • ut-of-plane

directions, respectively, while for the fabric model, the in-plane fill, in-plane warp and out-of-plane directions, respectively. Failure criteria of UD and PW laminate model are consisted of three fiber failure ones, such as tensile/shear fiber mode, compression fiber mode and crush mode under pressure, and two matrix failure

  • nes

without fiber failure, such as perpendicular matrix mode and parallel matrix mode (delamination). They are chosen in terms of quadratic strain forms as follows [2, 3]. 2.1 Unidirectional laminar damage functions

  • Tensile/shear fiber mode

1

2 2 2 2 1

                    

FS ca ab aT a

S τ τ S σ f

  • Compressive fiber mode
slide-3
SLIDE 3

2 1

2 2 c b a a aC a

σ σ σ σ , S σ f                  

  • Crush mode

3 1

2 3 c b a FC

σ σ σ

  • , p

S p f              

  • Perpendicular matrix mode

1

2 2 2 4

                          

ab ab bc ' bc bT b

S τ S τ S σ f

  • Parallel matrix mode (Delamination)

1

2 2 2 2 5

                                    

ca ca bc " bc cT c

S τ S τ S σ S f

where < > are Macaulay brackets,

aT

S

and

aC

S

are the tensile and compressive strengths in the fiber direction, and

FS

S

and

FC

S

are the layer strengths associated with the fiber shear and crush failure, respectively.

bT

S

and

cT

S

are the transverse tensile

  • strengths. The shear strengths for the transverse

shear failure and the two axial shear failure modes are assumed to be the following forms, based on the Coulomb-Mohr theory:

 

 

 

 

b ab bc ' b ab ab

σ S S σ S S         tan , tan

 

 

 

 

c bc bc " c ca ca

σ S S σ S S         tan , tan

where  is a material constant, and

 

ab

S

,

 

ca

S

and

 

bc

S

are the shear strength values of the

corresponding tensile modes.

2.2 Fabric lamina damage functions

  • Fill/Warp fiber tensile/shear failure modes

 

FS aFS aFS ca ab aT a

S , S S S f               1

2 2 2 2 6

  

 

aT bT FS aFS bFS bc ab bT b

S S S , S S S f * 1

2 2 2 2 7

                

  • Fill/Warp fiber compressive failure modes

c a a ' aC a '

σ σ , σ S σ f                1

2 8

c b b ' bC b '

σ σ , σ S σ f                1

2 9

  • Fiber crush failure mode under compressive

pressure

3 1

2 10 c b a FC

σ σ σ

  • , p

S p f              

  • In-plane matrix shear failure mode

1

2 11

          

ab ab

S τ f

  • Through-thickness matrix failure mode

(delamination)

1

2 2 2 2 12

                                      

ca ca bc bc cT c

S τ S τ S σ S f

where

aT

S

and

bT

S

are the axial tensile strengths in the fill and warp directions, respectively, and

aFS

S

and

bFS

S

are the layer shear strengths due to fiber shear failure in the fill and warp directions.

aC

S

and

bC

S

are the axial compressive strengths in the fill and warp directions, respectively.

FC

S

is the fiber crush strength, and

ab

S

, the layer shear strength due to matrix shear failure.

cT

S

is the through-thickness tensile strength, and

bc

S

and

ca

S

are the shear strengths assumed to depend on the compressive normal stress,

c

σ , as follows:

 

 

 

 

c bc bc c ca ca

σ S S σ S S         tan , tan

2.3 Progressive Damage Modeling The most important another aspect of MAT_162 is the capability of modeling post-damage softening behavior of composites, that is, progressive damage. Elastic moduli reduction,

E E ) 1 (    

, is expressed in terms of an exponential damage functions,

   ,

/ ) / ( 1 exp 1 m

m y

     

with the strain softening parameter m for four different damage modes, such as

1

m and

2

m for fiber damages in material directions

1 and 2, respectively,

3

m for fiber crush and punch

shear, and

4

m for matrix crack and delamination. E

and E are the reduced and initial elastic moduli,

slide-4
SLIDE 4

respectively, and  and

y

 , the modulus reduction

parameter and the yield strain, respectively [2, 4, 5].

  • 3. Specimen Tests of Carbon/Epoxy Composite

Laminates Mechanical characteristics and weight drop tests were performed for UD and PW of carbon fiber/epoxy resin laminar specimens, such as tension, compression, shear in plane (V-notch) and shear between layers (SBS; short beam strength), and also weight drop tests, for the PW laminate specimens. Their tested specimens are shown in Figs. 5-9, their stress-strain curves of characteristics tests are shown in Fig. 10, and collision force and absorbed energy responses of weight drop test, in Fig. 11.

(a) UD 0° (b) UD 90° (c) PW fill (d) PW warp

  • Fig. 5 Carbon/Epoxy tensile test specimens

(a) UD 0° (b) UD 90° (c) PW fill (d) PW warp

  • Fig. 6 Carbon/Epoxy compressive test specimens

(a) UD (b) PW

  • Fig. 7 Carbon/Epoxy V-notch test specimens

(a) UD (b) PW

  • Fig. 8 Carbon/Epoxy SBS test specimens

(a) face (b) back (c) C scan

  • Fig. 9 Carbon/Epoxy weight drop test specimen

0.000 0.005 0.010 0.015 0.020 Strain 500 1000 1500 2000 2500 Tensile Stress (MPa) UD 0D Tension

1 2 3 4 5 6

0.005 0.01 Strain 10 20 30 40 50 Tensile stress(MPa) UD 90D Tension

1 2 3 4 5 6

(a) UD 0D Tension (b) UD 90D Tension

  • 0.010
  • 0.005

0.000 Strain 100 200 300 400 500 600 700 Compressive stress (MPa) UD 0D Compression

1 2 3 4 5 6

  • 0.005
  • 0.004
  • 0.003
  • 0.002
  • 0.001

0.000 Strain 50 100 150 200 Compressive Stress (MPa) UD 90D Compression

1 2 3 4 5 6

(c) UD 0D Compression (d) UD 90D Compression

  • 0.010
  • 0.005

0.000 Strain 10 20 30 40 50 Compressive stress (MPa) UD V-Notch 1 2 3 4 5 6 0.0 1.0 2.0 3.0 4.0 Compressive Extension (mm) 20 40 60 80 100 Compressive Stress (MPa) UD SBS

1 2 3 4 5 6

(e) UD V-Notch (f) UD SBS

0.000 0.005 0.010 0.015 strain 100 200 300 400 500 600 700 800 Tensile stress(MPa) PW Fill Tension

1 2 3 4 5 6

0.000 0.005 0.010 0.015 0.020 Strain 100 200 300 400 500 600 700 800 Tensile Stress (MPa) PW Warp Tension

1 2 3 4 5 6

(g) PW Fill Tension (h) PW Warp Tension

slide-5
SLIDE 5
  • 0.015
  • 0.010
  • 0.005

0.000 Strain 100 200 300 400 500 Compressive Stress (MPa) PW Fill Compression

1 2 3 4 5 6

  • 0.015
  • 0.010
  • 0.005

0.000 Strain 100 200 300 400 500 600 Compressive Stress (MPa) PW Warp Compression

1 2 3 4 5 6

(i) PW Fill Compression (j) PW Warp Compression

  • 0.05
  • 0.04
  • 0.03
  • 0.02
  • 0.01

0.00 Strain 50 100 150 Compressive stress (MPa) PW V-Notch

1 2 3 4 5 6

0.0 0.5 1.0 1.5 Compressive Extension (mm) 20 40 60 80 100 Compressive Stress (MPa)

PW SBS 1 2 3 4 5 6

(k) PW V-Notch (l) PW SBS

  • Fig. 10 Stress-strain curves of Carbon/Epoxy UD &

PW characteristics test

1 2 3 4 5 6 7 8 Time (msec) 1000 2000 3000 4000 5000 Load (N) 2 4 6 8 10 Energy (J) C25-1L Load Energy 1 2 3 4 5 6 7 8 Time (msec) 1000 2000 3000 4000 5000 Load (N) 2 4 6 8 10 Energy (J) C30-1L Load Energy

(a) C25 (b) C30

  • Fig. 11 Collision force and absorbed energy

responses of weight drop tests

  • 4. Structural Analysis Simulations of Carbon/

Epoxy Composite Laminates Progressive damage simulations were carried out for the mechanical characteristics tests of UD and PW laminar specimens and weight drop tests of PW ones, as shown in Chapter 3, using MAT_162 of LS- DYNA code. Figures 12 and 13 illustrate the progressive damage configurations and stress-strain curves for the UD and PW laminate characteristics test simulations, and Fig. 14, for the PW laminate weight drop test

  • ne. Material properties and calibrated parameters

for the UD and PW carbon fiber/epoxy resin in this simulation are summarized in Table 1.

0.005 0.01 0.015 0.02 Strain 400 800 1200 1600 2000 Tensile stress (MPa) UD 0deg Tension Experiment Simulation

(a) UD 0° tensile

0.005 0.01 0.015 0.02 Strain 10 20 30 40 50 Tensile stress (MPa) UD 90deg Tension Test Simulation

(b) UD 90° tensile

  • 0.010
  • 0.005

0.000 Strain 100 200 300 400 500 600 700 Compression stress (MPa) UD 0deg Compression Experiment Simulation

(c) UD 0° compressive

  • 0.050
  • 0.040
  • 0.030
  • 0.020
  • 0.010

0.000 Strain 100 200 300 400 500 Compression stress (MPa) UD 90 deg Compression Experiment Simulation

(d) UD 90° compressive

  • 0.01
  • 0.005

Strain 20 40 60 80 100 Tensile stress (MPa) UD V-notch Experiment Simulation

(e) UD V-notch

1 2 3 4 5 Compressive extension (mm) 20 40 60 80 100 Compressive stress (MPa) UD SBS Experiment Simulation

(f) UD SBS

  • Fig. 12 Damage configurations and stress-strain

curves of UD laminate test simulation

0.005 0.01 0.015 Strain 100 200 300 400 500 600 700 800 Tensile stress (MPa) PW Fill Tension Experiment Simulation

(a) PW tensile

slide-6
SLIDE 6
  • 0.010
  • 0.005

0.000 Strain 100 200 300 400 500 Compress stress (MPa) PW Fill Compression Experiment Simulation

(b) PW compressive

  • 0.05
  • 0.04
  • 0.03
  • 0.02
  • 0.01

0.00 Strain 50 100 150 Compressive stress (MPa) PW V-Notch Experiment Simulation

(c) PW V-notch

0.5 1 1.5 Compressive extension (mm) 20 40 60 80 100 Compressive stress (MPa) PW SBS Experiment Simulation

(d) PW SBS

  • Fig. 13 Damage configuration and stress-strain curve
  • f PW laminate test simulation

1 2 3 4 5 6 7 8 Time (msec) 2 4 6 8 10 Internal energy (J) C30-1L Experiment Simulation 1 2 3 4 5 6 7 8 Time (msec) 1000 2000 3000 4000 5000 Contact Force (N) C30-1L Experiment Simulation

  • Fig. 14 Damage configuration (delamination) and

collision response of weight drop test simulation Table 1 Material properties and calibrated parameters for Carbon/Epoxy UD and PW laminates

(a) UD laminate

RO (kg/m3) EA(GPa) EB(GPa) EC(GPa) PRBA PRCA PRCB 1,497.5 122.51 8.4 8.4 0.10 0.20 0.20 GAB(GPa) GBC(GPa) GCA(GPa) SAT(MPa) SAC(MPa) SBT(MPa) SBC(MPa) 4.76 1.5 1.5 1,835.4 700.0 40.5 184.2 SCT(MPa) SFC(MPa) SFS(MPa) SAB(MPa) SBC(MPa) SCA(MPa) SFFC 80.0 2,500.0 405.0 41.5 55.0 55.0 0.35 AMODEL PHIC E_LIMT S_DELM OMGMX ECRASH EEXPN 1 10 0.005 1.2 0.999 0.8 1.10 AM1 AM2 AM3 AM4 1.0 0.001 0.5 0.3

(b) PW laminate

RO (kg/m3) EA(GPa) EB(GPa) EC(GPa) PRBA PRCA PRCB 1,497.5 62.5 62.5 20.0 0.06 0.08 0.08 GAB(GPa) GBC(GPa) GCA(GPa) SAT(MPa) SAC(MPa) SBT(MPa) SBC(MPa) 4.76 1.3 1.3 1,300.0 800.0 1,300.0 800.0 SCT(MPa) SFC(MPa) SFS(MPa) SAB(MPa) SBC(MPa) SCA(MPa) SFFC 48.0 1,000.0 600.0 70.0 60.0 60.0 0.35 AMODEL PHIC E_LIMT S_DELM OMGMX ECRASH EEXPN 2 10 0.005 1.2 0.999 0.8 1.10 AM1 AM2 AM3 AM4 1.0 1.0 0.5 0.8

  • 5. Conclusions

Characteristics and weight drop tests

  • f

Carbon/Epoxy composite laminar specimens were performed, and their mechanical properties, damage states and mechanisms were examined according to

  • test. Progressive damage analysis techniques were

developed using material model MAT_162 linked with LS-DYNA code with the investigation of their damage mechanism and calibration of their

  • parameters. Through this study, it might be thought

that the optimum structural design of composite laminates and propeller could be derived with high accuracy for the maximization of its performance at the reversed design stage by the estimation of their strengths, energy absorption capacities and damage states according to the diverse fiber arrays. References

[1] Lee, S.G., Byun, J.H., Paik, B.G. and Hyun, B.S. “Production & Performance Assessment

  • f

Composite Material Flexible Propeller”. Journal of the Society of Naval Architects of Korea, Vol. 46,

  • No. 6, pp. 667-674, 2009.

[2] LSTC “LS-DYNA User's Manual, Version 971 R4”. Livermore Soft Technology Corp., USA, 2009. [3] Xiao, J.R., Gama B.A. and Gillespie J.W. Jr. “Progressive damage and delamination in plain weave S-2 glass/SC-15 composites under quasi- static punch-shear loading”. Composite Structures,

  • Vol. 78, pp. 182–96, 2007.

[4] Gama, B.A., Bogetti, T.A. and Gillespire Jr., J.W. “Progressive damage modeling of plain-weave composites using LS-DYNA composite damage model MAT 162”. 7th European LS-DYNA Conference, 2009. [5] Matzenmiller, A., Lublinear, J. and Taylor, R.L. “A constitutive model for anisotrpic damage in fiber- composites”. Mechanics of Materials, Vol. 20, pp. 125∼152, 1995.