estimation of electric charge signals for piezoelectirc
play

ESTIMATION OF ELECTRIC CHARGE SIGNALS FOR PIEZOELECTIRC DAMAGE - PDF document

18 TH INTERNATIONAL CONFERENCE ON COMPOSITE MATERIALS ESTIMATION OF ELECTRIC CHARGE SIGNALS FOR PIEZOELECTIRC DAMAGE MONITORING OF GLASS FIBER EPOXY COMPOSITES BY FINITE ELEMENT METHOD H.Y. Hwang 1* , S. K. Hwang 1 , S. M. Oh 1 1 Department of


  1. 18 TH INTERNATIONAL CONFERENCE ON COMPOSITE MATERIALS ESTIMATION OF ELECTRIC CHARGE SIGNALS FOR PIEZOELECTIRC DAMAGE MONITORING OF GLASS FIBER EPOXY COMPOSITES BY FINITE ELEMENT METHOD H.Y. Hwang 1* , S. K. Hwang 1 , S. M. Oh 1 1 Department of Mechanical Design Engineering, Andong National University, Andong, Korea * Corresponding author(hyhwang@andong.ac.kr) Keywords : Polymeric Composite, Piezoelectric Damage Monitoring, Finite Element Analysis press molding method under standard cure cycle 1 General Introduction suggested by manufacturer, and then cut by diamond Polymeric composites have defects by the imperfect wheel cutter. manufacturing or damage in service inevitably, and Overall length, width, thickness, and initial crack thus damage monitoring skills have been developed length were 150, 10, 4.0, 50mm, respectively. to improve the reliability of damaged composite Electrode to measure or analyze electric charge structures [1-3]. signals were fabricated on the specimen surfaces of One of damage monitoring methods for polymeric 60 mm apart from the loading position. Mechanical composites is the piezoelectric method introduced and piezoelectric properties of unidirectional glass recently. The availability of the piezoelectric method fiber epoxy composites with the fiber orientation of 0 o are listed in Table 1. 
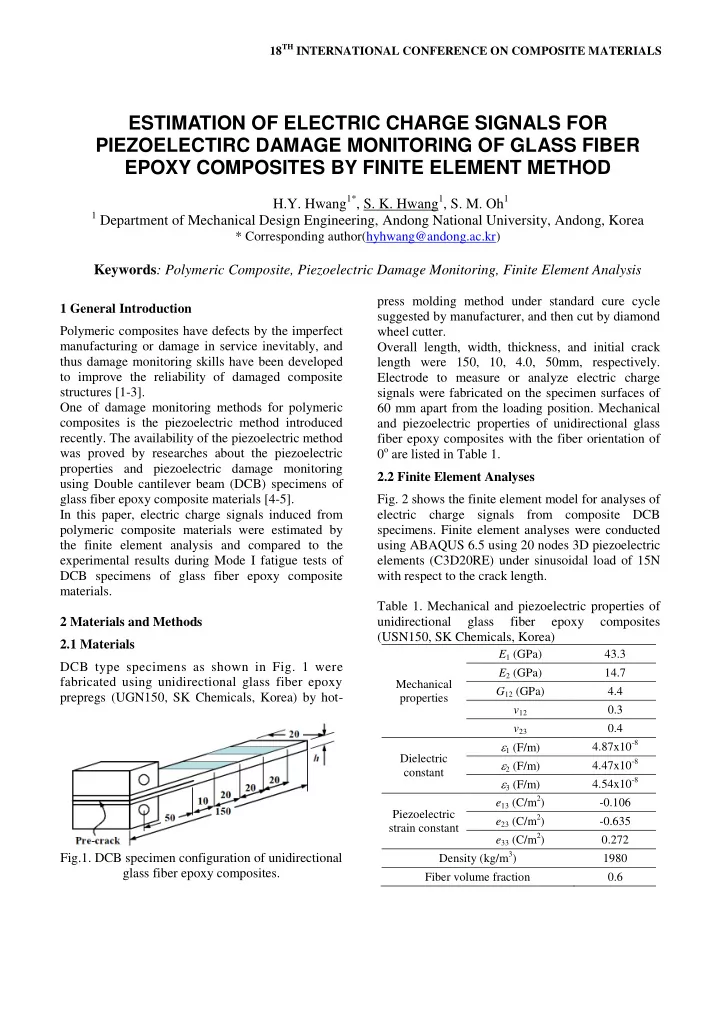
was proved by researches about the piezoelectric properties and piezoelectric damage monitoring 2.2 Finite Element Analyses using Double cantilever beam (DCB) specimens of glass fiber epoxy composite materials [4-5]. Fig. 2 shows the finite element model for analyses of In this paper, electric charge signals induced from electric charge signals from composite DCB polymeric composite materials were estimated by specimens. Finite element analyses were conducted the finite element analysis and compared to the using ABAQUS 6.5 using 20 nodes 3D piezoelectric experimental results during Mode I fatigue tests of elements (C3D20RE) under sinusoidal load of 15N DCB specimens of glass fiber epoxy composite with respect to the crack length. materials. Table 1. Mechanical and piezoelectric properties of 2 Materials and Methods unidirectional glass fiber epoxy composites (USN150, SK Chemicals, Korea) 2.1 Materials E 1 (GPa) 43.3 DCB type specimens as shown in Fig. 1 were E 2 (GPa) 14.7 fabricated using unidirectional glass fiber epoxy Mechanical G 12 (GPa) 4.4 prepregs (UGN150, SK Chemicals, Korea) by hot- properties v 12 0.3 v 23 0.4  1 (F/m) 4.87x10 -8 Dielectric  2 (F/m) 4.47x10 -8 constant  3 (F/m) 4.54x10 -8 e 13 (C/m 2 ) -0.106 Piezoelectric e 23 (C/m 2 ) -0.635 strain constant e 33 (C/m 2 ) 0.272 Density (kg/m 3 ) Fig.1. DCB specimen configuration of unidirectional 1980 glass fiber epoxy composites. Fiber volume fraction 0.6

  2. All the nodes on the crack surface were doubly Since there was no strain between electrodes until defined to model the crack surface, and released the crack tip reached the front end of electrodes, the with each other to represent the crack growth [3]. electric charge signal was not induced. While the Nodes at the center line of the end surface were crack tip passed through composite specimens fixed and electric field of nodes on the lower between electrodes, there were large strains and electrode was set to 0 V/m. And then electric flux induce electric charges increased. After the crack tip density of nodes on the upper electrode was passed, the strain between electrodes decreased very analyzed. fast and kept small. Therefore, finite element analysis results also described this phenomenon. 2.3 Experiments Fig. 4 represents the measured electric flux density Mode I fatigue tests of composite DCB specimens with respect to the fatigue cycle by Mode I fatigue were performed on the dynamic material testing tests of unidirectional glass fiber epoxy composite machine (Instron 8526, Instron Co., USA) under DCB specimens. Electric flux density increased sinusoidal load of 15N with 1Hz. Electrodes were slowly after 50,000 cycles, increased abruptly after fabricated using electrically conducting silver paste 85,000 cycles, and then scattered near the final (SSP-102P, Seoul Chemical Industrial, Korea) for fracture. measuring electric charge signals of DCB specimens. Fig. 5 shows the measured crack length with respect Induced electric charge signals were measured by to the fatigue cycle by Mode I fatigue tests of the charge conditioning amplifier (type 2626, unidirectional glass fiber epoxy composite DCB Bruel&Kjar Co., Denmark) and the crack length specimens. After 46,000 cycles, the initial crack were recorded by analyzing magnifier images every begun to propagate very slowly. Crack propagation 1000 cycles. was visibly after 60,000 cycles, steeply after 85,000 cycles, and lead to final fracture. 3 Results and Discussions 60 Fig. 3 depicts the relationship between electric flux 50 density and crack length by finite element analyses Electric Flux Density (nC/m 2 ) of unidirectional glass fiber epoxy composite DCB 40 specimens. Electric flux density begun to increase 30 when the crack length was about 60mm (front end of electrodes), increased sharply until the crack length 20 was about 80mm (rear end of electrodes), and then 10 decreased. Since the piezoelectric damage monitoring of 0 polymeric composite materials used the 40 60 80 100 120 140 phenomenon of the electric charge output induced Crack length (mm) Fig.3. Electric flux density with respect to crack by the material deformation under the external load, length by finite element analyses experiments for the important parameter for affecting the electric piezoelectric damage monitoring of unidirectional charge outputs is the strain between electrodes. glass fiber epoxy composite DCB specimens. Fig.2. Finite element model for analyzing electro-mechanical behavior of unidirectional glass fiber epoxy composite DBC specimens.

  3. PAPER TITLE In order to compare results of finite element 4 Conclusions analyses and experiments directly, measured electric In this work, we analyzed the electric charge outputs flux density-fatigue cycle curve was re-plotted of unidirectional glass fiber epoxy composites with measured electric flux density-crack length curve respect to the crack length by the finite element from Fig. 4 and 5. As shown in Fig. 6, results of approach for piezoelectric damage monitoring. In finite element analyses and experiments were similar order to verify finite element analysis results, Mode trend except data near the final fracture. I fatigue tests also performed using DCB specimens, Therefore, we can conclude that the finite element and the electric charge signal and crack length were method can predict the electric charge signals of measured. Experimental works were processed to glass fiber epoxy composites for piezoelectric electric flux density-crack length curve. damage monitoring, and the crack length of polymer By comparison between finite element analysis and composite DCB specimens during Mode I fatigue experimental results, estimated electric charge tests by measuring the electric charge signals. signals are well agreed with measured ones. Therefore, we can predict the electric charge signals with respect to the crack length by the finite element analysis for piezoelectric damage monitoring of 60 unidirectional glass fiber epoxy composites. Moreover the crack length can be estimated by 50 Electric Flux Density (nC/m 2 ) measuring the electric charge signals during 40 dynamic tests of unidirectional glass fiber epoxy composites. 30 20 10 Acknowledgments 0 This research was supported by Basic Science 0 10 20 30 40 50 60 70 80 90 100 Research Program through the National Research Fatigue Cycles (x1000 cycles) Foundation of Korea (NRF) funded by the Ministry Fig.4. Measured electric flux density with respect to of Education, Science and Technology (2010- fatigue cycles during Mode I fatigue tests of 0023918). unidirectional glass fiber epoxy composite DCB specimen. 60 140 FEM 50 120 Experiment Electric Flux Density (nC/m 2 ) Crack Length (mm) 100 40 80 30 60 20 40 10 20 0 0 40 60 80 100 120 140 0 10 20 30 40 50 60 70 80 90 100 Crack length (mm) Fatigue Cycles(x1000 cycles) Fig.6. Comparison of electric flux densities by finite Fig.5. Measured crack length with respect to fatigue element analyses and experiments for piezoelectric cycles during Mode I fatigue tests of unidirectional damage monitoring of unidirectional glass fiber glass fiber epoxy composite DCB specimens. epoxy composite DCB specimens. 3

Download Presentation
Download Policy: The content available on the website is offered to you 'AS IS' for your personal information and use only. It cannot be commercialized, licensed, or distributed on other websites without prior consent from the author. To download a presentation, simply click this link. If you encounter any difficulties during the download process, it's possible that the publisher has removed the file from their server.

Recommend


More recommend