Presenting Academic Work Engage, Talk, Visualize Jrg Cassens - - PDF document

presenting academic work
SMART_READER_LITE
LIVE PREVIEW

Presenting Academic Work Engage, Talk, Visualize Jrg Cassens - - PDF document

Presenting Academic Work Engage, Talk, Visualize Jrg Cassens Academic Literacy Winter term 2019/2020 Welcome Ladies and Gentlemen.. . Presentations and Talks: Motivation Presentation Layout Disruptions Feedback


slide-1
SLIDE 1

Presenting Academic Work

Engage, Talk, Visualize

Jörg Cassens Academic Literacy Winter term 2019/2020

Welcome

  • Ladies and Gentlemen.. .
  • Presentations

and Talks: – Motivation – Presentation – Layout – Disruptions – Feedback
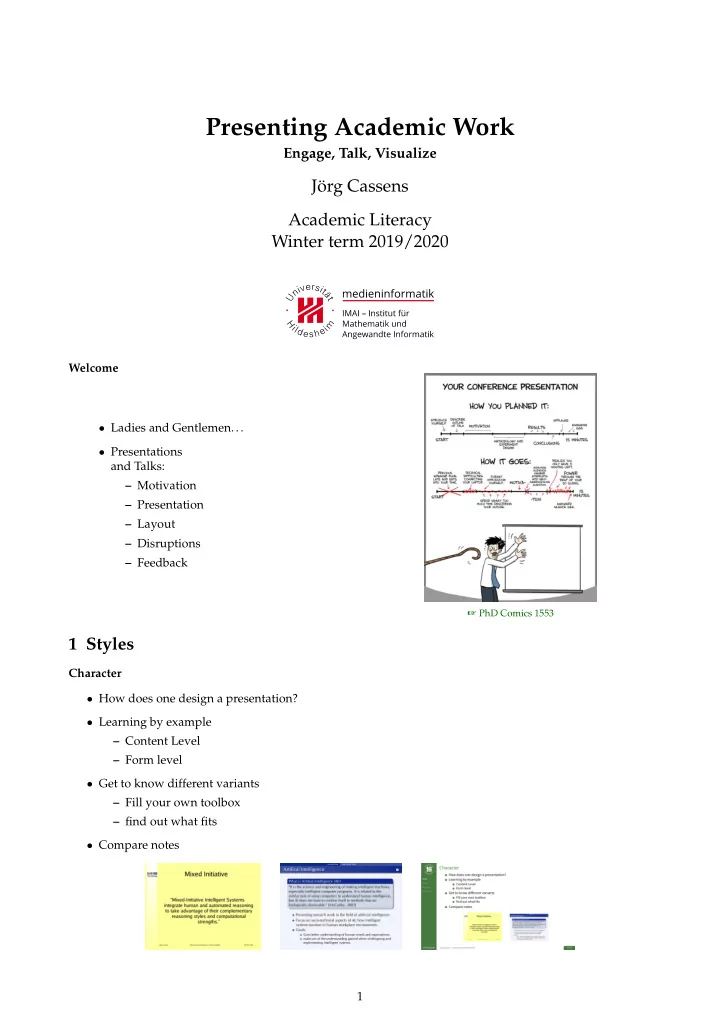
☞ PhD Comics 1553

1 Styles

Character

  • How does one design a presentation?
  • Learning by example

– Content Level – Form level

  • Get to know different variants

– Fill your own toolbox – find out what fits

  • Compare notes

1

slide-2
SLIDE 2

Role Models

  • Two potential role models

– Bill Gates – Steve Jobs

  • ☞ Garr Reynolds (2005): Gates, Jobs, & the Zen aesthetic

☞ xkcd: teaching physics We have lots to show to you! We have lots to show to you as well!

2

slide-3
SLIDE 3

The big (colourful) picture I need your full attention for the next topics...

Take Away Focus

  • Reduced design language/simplicity
  • Reduced colour palette
  • Do not be afraid of white space
  • A slide is not a handout

Caveat But: Find your own style. Not everybody is like Steve Jobs.

2 Present

Present & Visualize

  • Present

– Definition – Preparation – Execution 3

slide-4
SLIDE 4

– Non-verbal behaviour – Reflection

  • Visualize

– Definition and Goals – Design elements – Colours and Shapes – Composition – Tips Definition

  • What?

– Connecting ∗ verbal, ∗ non-verbal and ∗ visual means of communication to make certain content accessible for a recipient

  • How?

– Consistent, clear structure – Successful visualization – Authentic presentation behavior – Multi-medial, Multi-modal, Multi-codal Dual Coding

Dual-coding-theory: Paivio [1986]

Communication 4

slide-5
SLIDE 5

Grounding Function Grounding Function Person Sign Expression Plane Content Plane Organizing Function Organizing Function Expression Plane Content Plane physical biological context socio material context

Meaner Receiver

Meaner Potential Semantics Grammar Behaviour Components Meaning Potential Interface Function Interface Function

Source: Wegener [2011, 2015]

Preparation

  • Three reference points for determining the content

– Goals – Content – Time

  • Yardstick for selection of content
  • Goals:

– Which goal (e.g., learning objective) would I like to achieve?

  • Content:

– What content is necessary to achieve my goal?

  • Time:

– How much time is available? ∗ and how long would the audience like to listen? Collect, Select, Compress, Express

  • 1. Collect & select content
  • What would be suitable for presentation?

– Topics – Examples – Visuals

  • 2. Compress content
  • Reduce to the important

– You don’t have much time 5

slide-6
SLIDE 6
  • 3. Express content
  • Bring the content into shape
  • Textual representation
  • Visualization

Compress

  • new information takes precedence over known ones
  • Focus on most important information

– To reach your goal – To satisfy the target audience

  • Make use of context

– Prior knowledge

  • Restrict yourself to the essentials

☞ xkcd: proofs

Target Audience

  • Context of talk important
  • Centred around the audience

– How large is the audience? – Any commonalties? ∗ Age ∗ Gender ∗ Profession ∗ Prior knowledge – What do the participants expect? – What are they interested in? Context

Target Audience Content Time Topic/Goal

Context

Setting Organisation Media Attendants

What happens before and afer this talk? Seating arrangement? Who is chairing? How many attendants expected? What do they know & expect? Is the audience homogeneous? What media are available? When do I check them? Do I want to use a handout?

6

slide-7
SLIDE 7

Organisation I

  • Length, breaks

– Review of the length of the lecture – Prepare “Emergency program” (select the most important points) – Do not talk for more than 45 minutes

  • Documents for participants (handout)

– Design as text (in its own right) or as an image of the slides – Always discussed: when to hand it out? ∗ before: to annotate ∗ after: probably with extensions

  • Personal preparation

– Visualize sequence of the presentation in your mind – Create notes, index cards, or a presentation guide – Clarify dress code

  • Media

– Available? – In working order? Organisation II

  • Check presentation technology

– Projector – Wifi, Internet – Computer, software – Connections, Cables, Adapters – Loudspeaker – Presenter – . . .

  • Anticipate problems

– Live-Demo ∗ Video and/or screenshots of the system – Presentation ∗ Laptop ∗ USB-Stick ∗ Dropbox.. . ∗ E-Mail ∗ Printout ∗ . . . Preparation

  • Check spelling

– Best by another person

  • Practice talk, best.. .

– in the right room – in front of an audience 7

slide-8
SLIDE 8

– with the technical means to be used

  • While doing that or after

– Take time, usually required: ∗ BA-/MA-Colloquia: 30 minutes talk, 15 minutes demo ∗ Seminar: 30 minutes, 15 minutes discussion ∗ Project/lab course: 30 minutes, maybe including demo – revise problematic passages – identify & reduce skip actions Skeleton

  • Introduction (5%)

– Welcome the audience – Present yourself – Arrange the formalities – Introduce topic & goal – Present the structure

  • Main part (75%)

– . . .

  • Conclusions (20%)

– Summary – Move to discussion – Marking the end Introduction

  • Welcome
  • Introducing yourself

– Embedding into context

  • Agreement on style and procedure

– When are questions asked? – Is something demonstrated?

  • Introduce topic and goal

– motivate the audience to listen ∗ ask questions ∗ Show benefits ∗ provoke (sparingly) ∗ entry joke Main Part

  • Speak freely (index cards)
  • Keep eye contact

– Talk to the audience, not the wall (screen)

  • Short, understandable sentences
  • Use your voice in a targeted manner
  • Take breaks

8

slide-9
SLIDE 9
  • Do not play with a pen, pointer, etc.

– But you can stick to the pen

  • Involve listeners
  • Give summaries in between
  • Use redundancy consciously
  • Build some dramatic effect

– Posters, situational foils, situational logo Finish

  • Short Summary
  • Designated time frame & objective for discussion
  • Move to discussion/workshop phase
  • Clarify what will happen with results
  • At the end: thanks for participation

– But no “thank you” slide – Better: title page or slide with contact details Disruptions

  • Late arrivals

– Welcome by eye-contact only

  • Questions

– Depending on the agreed upon procedure: answer or refer to later

  • Slip of the tongue

– Correct, do not apologize

  • Forgotten terms

– Describe

  • Chatty audience

– Eye contact, direct questions

  • Technical mishaps

– Continue without media or break Slides

  • Presentation must be visible to all
  • Stay out of line of sight
  • Do not talk to the media, but to the people
  • Use visualization as a “thread”
  • Projector: try the mouse instead of a laser

– Laser pointers can irritate quickly – Therefore: Use sparingly (we are no cats) – By no means point to everything you say (karaoke) 9

slide-10
SLIDE 10

Structure

  • Structuring: (intermediate) headings
  • Situation: Where in the talk are we?

– At the beginning: agenda – During the talks: ∗ hinted on every slide (eg as with LaTeX beamer) or ∗ repetition of the agenda as intermediate foils

  • Page numbers

Verbal & Non-verbal

  • Voice

– Control speed – Use breaks in speech – Control sound, tone, volume

  • Posture

– Upright

  • Movement

– Natural – No subconscious movement

  • Gesture

– Fitting the content – Avoid uncertainty – Authentic

  • Eye contact

– Builds relationship – Catching signals Briefing and Reflection

  • Why?

– optimize – learn from mistakes

  • What?

– goal reached? – talk suitable for audience? – was structure okay? – opening succeeded? – conclusion succeeded? – was use of media okay? 10

slide-11
SLIDE 11

3 Visualize

Present & Visualize

  • Present

– Definition – Preparation – Execution – Non-verbal behaviour – Reflection

  • Visualize

– Definition and Goals – Design elements – Colours and Shapes – Composition – Tips Text I

  • Text

– Good readability – Be aware of reading habits: – left to right – from top to bottom

  • Consistent (own) style

– Corporate Identity

  • Legibility

– dark font – bright background

  • Font

– sans serif – if possible only one font

  • Navigation

– Chapter structure – Slide number Text II

  • Reduction to the essentials
  • Keywords instead of sentences
  • Visualizations examples
  • Four intelligibility enhancers:

– simplicity – Structure & order – Shortness & conciseness – Additional stimuli Krug’s Third Law of Usability, 2005 “Get rid of half the words on each page, then get rid of half of what’s left.” 11

slide-12
SLIDE 12

What is Visualization

  • Visualizing is pictorial representation

– “A picture is worth a thousand words”

  • Aims:

– Make information easier to grasp – Give guidance – Provoke statements – Further memories

☞ xkcd: decline

Field of Visualization

  • Draws from many fields
  • Requires a deep and broad knowledge across several traditionally discrete subjects, including cognitive

science, semiotics, statistics, graphic design, cartography, and computer science

  • Goal: Communication

Source: Kirk [2012]

Graphic Elements

  • Graphs, icons, diagrams
  • What for?

– Avoid too much text – additional stimuli – Loosening up “dry” topics

  • and really?

– Clarification/highlighting of elements – Explanation of facts – Illustration of facts

  • Question: What should be achieved with the picture?

– choose appropriate visualization

  • no images/scans/photos of poor quality (pixelated, crooked, illegible, . . . )

– better to do it over yourself

  • Avoid 3D-effects or shadows
  • Use color sparingly

12

slide-13
SLIDE 13

Diagrams

  • Comparison of:

– absolute numbers – development courses – proportions

  • Illustration of:

– procedures – structures Layout

  • Pictures have captions

– Can be omitted if the image serves mainly structuring purposes or the content is communicated in the graphic

  • Pictures have numbers

– Can be omitted in numbered slides – otherwise number consecutively, possibly by chapter

  • Graphic processing of data

– Attach legend – Axes of the coordinate system intersect at the origin ∗ if not: indicate – Always specify axes and/or units – Make multiple curves easily distinguishable ∗ Texture/hatching, color, strength – Observe scientific layout rules ∗ 3D-effects usually counter-productive – Supplement the measures of the central tendency with dispersion measures 3D-Effects 13

slide-14
SLIDE 14

Error Bars Shapes & Colours

  • What for?

– Highlight important information – Clarify relationships – Make cross references between several representations clear – connect successive representations Pie Charts

☞ schule.mupad.de/aktuelles/presse/bilder/index_11.shtml

Tables

  • avoid unnecessary (vertical) lines
  • maintain sufficient distance to the cell boundary (padding)
  • if possible: supplement with diagrams

14

slide-15
SLIDE 15

Composition and dramaturgy

  • Reveal/uncover and animation
  • Why?

– Suspense – Loosening up

  • And really?

– Visualization of processes, processes, phases – Clarification of differences and/or de- velopments – Not an end in itself! Process Visualization I

(aus Wirth 2004, S.64)

Process Visualization II 15

slide-16
SLIDE 16

Tips

  • maximum 3 colors per representation
  • Visually summarize sense units (color, spatial)

– Gestalt Principles

  • Emphasize important aspects
  • leave enough space
  • Font size at least 18 point (Powerpoint etc.)
  • sans serif font (Droid Sans, Frutiger, Helvetica, Futura)
  • Keep slides to show in case of questions

Ludwig Mies van der Rohe “Less is more!” References

References

Kirk, A. (2012). Data Visualization – A Successful Design Process. PACKT Publishing, Birmingham. Paivio, A. (1986). Mental representations: A dual-coding approach. Oxford University Press, New York. Wegener, R. (2011). Parameters of context: from theory to model and application. PhD thesis, Department of Linguistics, Macquarie University. Wegener, R. (2015). Continuing Discourse on Language. A functional perspective, Vol. 1, chapter Studying language in society and society through language: context and multimodal communication. Equinox.

16