Presentation of met.nos experience and expertise related to high - - PDF document

presentation of met no s experience and expertise related
SMART_READER_LITE
LIVE PREVIEW

Presentation of met.nos experience and expertise related to high - - PDF document

Presentation of met.nos experience and expertise related to high resolution re- analysis Oyvind Saetra, Ole Einar Tveito, Harald Schyberg and Lars Anders Breivik Norwegian Meteorological Institute Meteorologisk Instit ut t met.no Ice conc


slide-1
SLIDE 1

1

Meteorologisk Instit ut t met.no

Presentation of met.no’s experience and expertise related to high resolution re- analysis

Oyvind Saetra, Ole Einar Tveito, Harald Schyberg and Lars Anders Breivik Norwegian Meteorological Institute

Meteorologisk Instit ut t met.no

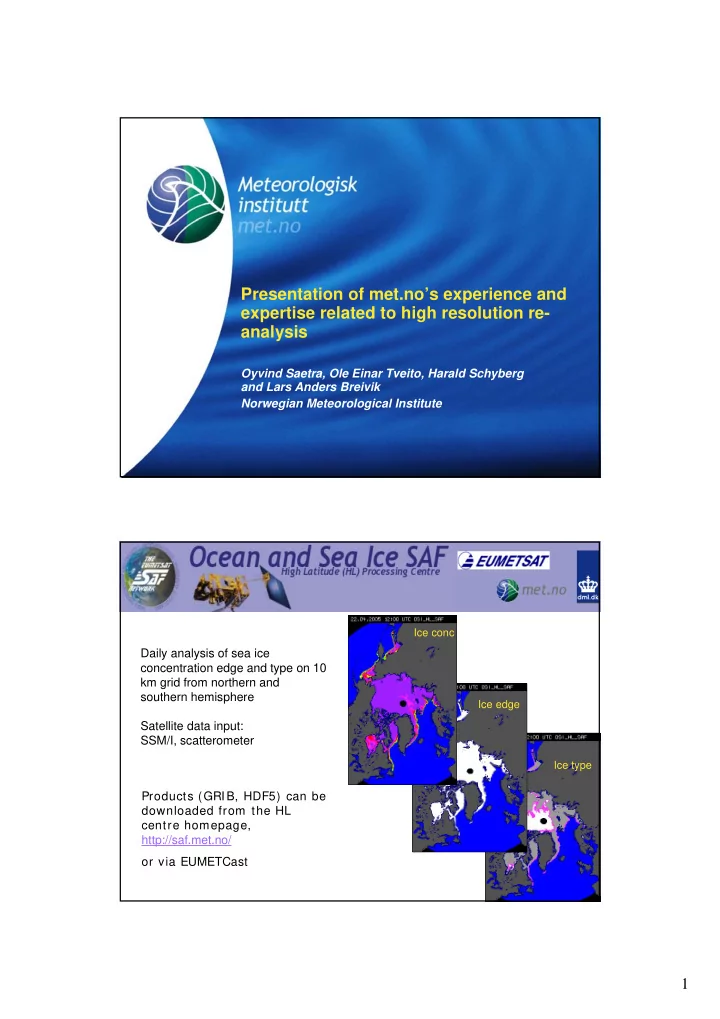
Products (GRIB, HDF5) can be downloaded from the HL centre homepage, http://saf.met.no/

  • r via EUMETCast

Ice conc Ice edge Ice type

Daily analysis of sea ice concentration edge and type on 10 km grid from northern and southern hemisphere Satellite data input: SSM/I, scatterometer

slide-2
SLIDE 2

2

Meteorologisk Instit ut t met.no

OSI SAF Sea ice reanalysis

  • Data used:

– Recalibrated SSM/I brightness temperature dataset from Remote Sensing Systems (1987 – 2005) – ECMWF ERA-40 reanalysis data (1987-2002) – Operational ECMWF short forecasts (2002-2005)

  • Partners

– met.no, DMI, UK Met Office

  • Improvements to be implemented before run

– Improved tiepoints (especially SH) – New algorithm(s): Suggest to process both Bristol and 85 GHz based fields – If successful: Correction of cloud liquid water using satellite derived information (R-factor)

Meteorologisk Instit ut t met.no

SST-analysis

  • A system for SST-

analysis based on OSI SAF sst products has been implemented

  • This is in use for the

HIRLAM model as well as for the

  • perational ocean

model MIPOM-arctic

slide-3
SLIDE 3

3

Meteorologisk Instit ut t met.no

Assimilation of SST and sea ice in coupled ice ocean model

Ice Concentration and SST is assimilated in the ocean and sea ice model system. The model receives updated ice concentration and SST (OSI SAF) valid at 12 hours before model analysis time. A nudging scheme is then executed during the 30 hour long assimilation period (hindcast period). The assimilation scheme has been refined to ensure consistent behavior of ice thickness and ice

  • concentration. The nudging of the

model values towards the data consists in melting or freezing of ice, which in the model translates into modifying the ice production rates.

Meteorologisk Instit ut t met.no

Met.no work on high-resolution modelling and data assimilation

Met.no is part of the HIRLAM consortium, and also has a cooperation with Met Office HIRLAM and Aladin/AROME started a cooperation on high-resolution NWP modelling in 2005 Met.no runs non-hydrostatic models MM5 and Met Office Unified Model

  • perationally (4km) at present, and intends to run Aladin/AROME in the

future Met.no intends to contribute to the development of a high-resolution data assimilation system in the framwork of HIRLAM-Aladin-AROME Work topics for high resolution assimilation: Assimilation of cloudy radiances, assimilation of radar wind and precipitation information

slide-4
SLIDE 4

4

Meteorologisk Instit ut t met.no

Experience with some particular

  • bservation types

Met.no has a particular interest in filling data gaps over ocean areas and Arctic regions covered by sea ice:

  • Experience on assimilation of scatterometer data (ocean

wind)

  • Work on methods for assimilating AMSU sounding data over

sea ice, particularly microwave surface emissivities over sea ice. Could contribute with methods for improving the use of such

  • bservations in a reanalysis

Meteorologisk Instit ut t met.no

An example: The effect of adding AMSU-A temperature sounding data

  • ver sea ice

A case from a longer impact study performed at met.no: A low pressure system is seen in the Barentz Sea when using AMSU-A over sea ice, but not in the reference run not using any AMSU-A. The existence of this low is supported by the few conventional observations available in the area. (Takes place in a period of predominantly Northerly upper winds in the area)

169 225 056 065 059 052 054 084 070 048 069 070 112 125 178 156 122 124 113 143 143 123 118 138 146 116 107 092 088 064 046 053 121 137 237 063 067 089 051 091 072 109 116

+24 hrs forecasts valid 00Z 14 March 2005

slide-5
SLIDE 5

5

Meteorologisk Instit ut t met.no

Gridded climatology products for Norway Gridded climatology products for Norway

  • spatial resolution 1x1 km

spatial resolution 1x1 km2

2

Monthly mean values Monthly mean values

  • Temperature and precipitation 1961-90

Monthly anomaly grids Monthly anomaly grids (with adj acent absolute value grids)

  • Temperature 1900-now
  • Precipitation 1900-now

Daily values Daily values: Primarily developed for hydrological purposes

  • Precipitation

Precipitation 01.01.1960 –30.06.2005 (Applying triangulation and/ or IDW with altitude adj ustment, in verification phase).

– Next step: Improved representation of terrain combined with circulation conditioned interpolation.

  • Temperature

Temperature 01.01.1960 –30.06.2005 (by residual interpolation )

Norwegian Meteorological Inst it ute met.no Meteorologisk Instit ut t met.no

RUGGED TERRAIN

S tandard deviation of the 1 x 1 km terrain model (GTOPO30) within a 10x10km domain.

Norwegian Meteorological Inst it ute met.no

slide-6
SLIDE 6

6

Meteorologisk Instit ut t met.no

Daily values: Daily values:

  • Residual interpolation

Residual interpolation (geo-statistical method) where climate signals due to terrain, distance to coast and other landscape characteristics are removed before interpolating the residuals.

  • Applies only in-situ observations
  • Why not NWP-models?

– S ystematic errors. – Long climate series:

  • Too computer demanding.
  • Data assimilation and inhomogeneities…

.

– Large area: S patial resolution (far) too coarse.

Norwegian Meteorological Inst it ute met.no Meteorologisk Instit ut t met.no

Daily values of temperature, Daily values of temperature, residual

residual interpolation, performance! interpolation, performance!

97250 Karasjok

  • 40
  • 30
  • 20
  • 10

10 20 30 30 60 90 120 150 180 210 240 270 300 330 360 Day nr. Temperature Observed Estimated

Norwegian Meteorological Inst it ute met.no

slide-7
SLIDE 7

7

Meteorologisk Instit ut t met.no

Daily mean temperature 14.09.2004

Norwegian Meteorological Inst it ute met.no Meteorologisk Instit ut t met.no

Precipitation

  • Currently using a

triangulation technique with terrain adjustment.

  • A very simple and rough

approach with very clear disadvantages, which is under replacement.

  • Example of an extreme rainfall event last

week based on a limited number of stations, max.observed precip. was 223 mm during 24 at a station in western Norway.

slide-8
SLIDE 8

8

Meteorologisk Instit ut t met.no

Input to other models. Input to other models.

  • Gridded climatological values can be used as input to distributed models in

e.g. hydrology and agro-ecology.

  • S

now mapping

– Potential for improved snow-analysis in NWP-models.

Norwegian Meteorological Inst it ute met.no Liquid water Precipitation Temperature Rain Runoff Snow Threshold temperature Snowpack with temperature dependent refreeze- and meltindexes Maximum liquid water content

Snow mapping Snow mapping

S now amount S now water equivalent(mm) Date 2004_04_23