Preparedness Boulder County Rainfall Historic Average Annual 19 - - PowerPoint PPT Presentation

preparedness
SMART_READER_LITE
LIVE PREVIEW

Preparedness Boulder County Rainfall Historic Average Annual 19 - - PowerPoint PPT Presentation

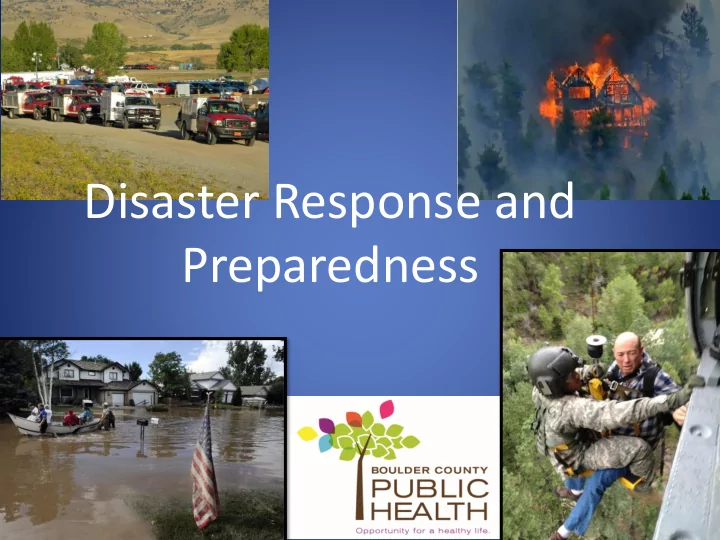
Disaster Response and Preparedness Boulder County Rainfall Historic Average Annual 19 Month of September 1.7 2013 Rainfall from Sept 9 -16 18.1 Back side of house from previous photo. Occupant was killed by wall of


slide-1
SLIDE 1

Disaster Response and Preparedness

slide-2
SLIDE 2
slide-3
SLIDE 3

Boulder County Rainfall

Historic Average

  • Annual 19”
  • Month of September 1.7”
  • 2013 Rainfall from Sept 9 -16

18.1”

slide-4
SLIDE 4
slide-5
SLIDE 5

Back side of house from previous photo. Occupant was killed by wall of water, rock and mud

slide-6
SLIDE 6
slide-7
SLIDE 7
slide-8
SLIDE 8
slide-9
SLIDE 9

Wildland Fires

slide-10
SLIDE 10
slide-11
SLIDE 11
slide-12
SLIDE 12
slide-13
SLIDE 13
slide-14
SLIDE 14

All Hazards Guidance

slide-15
SLIDE 15
  • Flood Response
  • Boil Water Order
  • Lack of Water
  • Rusty/Brown Water
  • Sewage Back-up
  • Natural Gas Outage
  • Fire
  • Noro-virus
  • Chemical Incidents and Noxious Fumes
slide-16
SLIDE 16
  • Available online www.BoulderCountyFood.org
slide-17
SLIDE 17

Playbook

Includes: Roles Emergency response objectives Primary Messages Primary Activities Practical Guidance Covering a host of environmental hazards

slide-18
SLIDE 18

Emergency Exercise Planning

  • Establish objectives
  • Establish roles (Facilitator, Evaluator)
  • Develop modules or use existing
  • Conduct the Exercise
  • Debrief
  • Address lessons learned
slide-19
SLIDE 19
  • B

FDA Exercises

Wilted Woes How Sweet it isn’t Insider Addition Stealthy Situation High Plains Harbinger

slide-20
SLIDE 20

Environmental Health Training in Emergency Response (EHTER)

slide-21
SLIDE 21