predicting failure mechanisms in t shaped aerospace
play

PREDICTING FAILURE MECHANISMS IN T-SHAPED AEROSPACE COMPOSITE - PDF document

18 TH INTERNATIONAL CONFERENCE ON COMPOSITE MATERIALS PREDICTING FAILURE MECHANISMS IN T-SHAPED AEROSPACE COMPOSITE STRUCTURES F. Hlnon 1 , M.R. Wisnom 1 , S.R. Hallett 1* and R.S. Trask 1 1 Advanced Composites Centre for Innovation and


  1. 18 TH INTERNATIONAL CONFERENCE ON COMPOSITE MATERIALS PREDICTING FAILURE MECHANISMS IN T-SHAPED AEROSPACE COMPOSITE STRUCTURES F. Hélénon 1 , M.R. Wisnom 1 , S.R. Hallett 1* and R.S. Trask 1 1 Advanced Composites Centre for Innovation and Science, University of Bristol, Queen’s Building, University Walk, Bristol BS8 1TR, UK * Corresponding author (fabrice.helenon@bristol.ac.uk) Keywords : Composite Structures, Stress Concentration, Delamination, Failure Initiation neighbourhood of a stress concentration, any FE 1. General introduction stress distribution with the distribution induced by This work addresses the problem of modelling via the presence of an abstract crack on the point of commercially available finite element (FE) codes the propagating. If the stress levels encountered in the failure mechanisms in laminated composite joints FE analysis are less than what could be induced by such as T-shaped specimens, which are typically this abstracted crack, they should be without any encountered in vanes, stiffeners and other aerospace consequences on the composite structure. The structures. Because of their relative complexity, the predictions are then confirmed via non-linear FE prediction of both their damage resistance and analyses involving interface elements. failure mechanism is fundamental for a conservative design. In this paper, experimental and numerical 2. Experimental results investigations are presented on specimens manufactured from IM7/8552 carbon/epoxy pre- The T-piece specimen under consideration in this impregnated laminates. paper, see fig. 1, is composed of three separately laid-up sections: two curved and one straight with a y fill-in deltoid region made from 90º unidirectional tows of the same material system. The flange has a 4.572 mm N N (60/0/-60/0) 3S layup for the platform plus a (±45 2 /0 7 /90 4 /0 3 ) lay-up which has come down from x  F the web. More experimental and manufacturing F z details can be found in [5]. The experimental testing 5 mm external 40 mm web configurations for specimens with the deltoid areas radius fillet corresponding to the nominal dimensions and the 40 mm enlarged pictures at failure of the crack formation 5.334 mm flange are given in figs. 2-5. Table 1 summarises the 20 mm platform average failure load values obtained from the four deltoid test cases. 
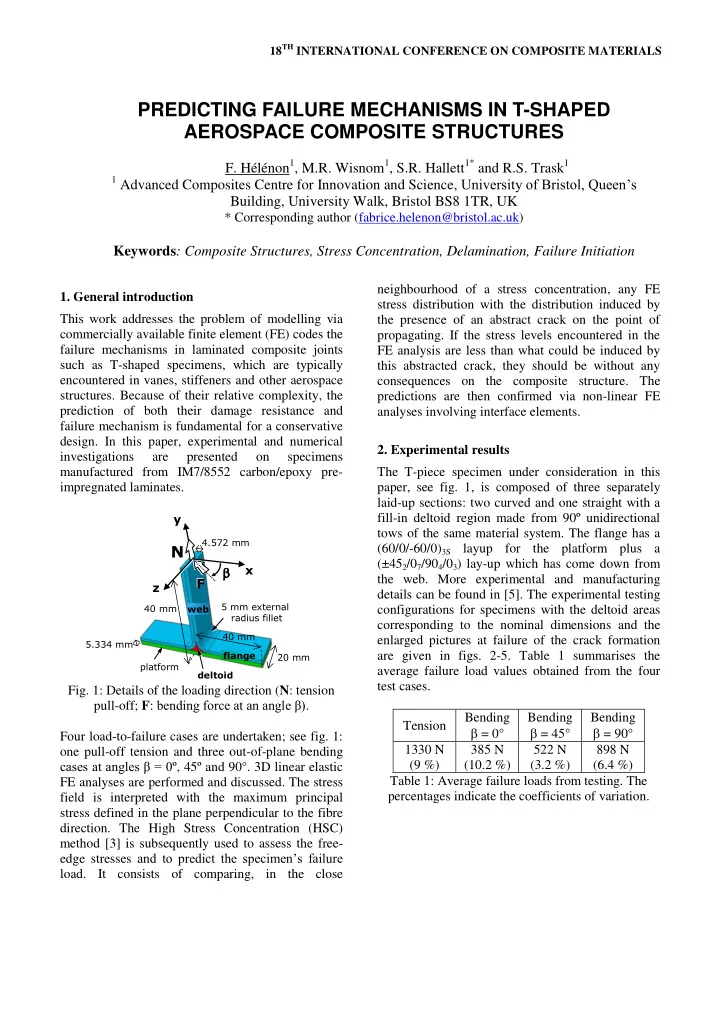
Fig. 1: Details of the loading direction ( N : tension pull-off; F : bending force at an angle β) . Bending Bending Bending Tension  = 0°  = 45°  = 90° Four load-to-failure cases are undertaken; see fig. 1: 1330 N 385 N 522 N 898 N one pull-off tension and three out-of-plane bending cases at angles β = 0 º, 45º and 90°. 3D linear elastic (9 %) (10.2 %) (3.2 %) (6.4 %) Table 1: Average failure loads from testing. The FE analyses are performed and discussed. The stress percentages indicate the coefficients of variation. field is interpreted with the maximum principal stress defined in the plane perpendicular to the fibre direction. The High Stress Concentration (HSC) method [3] is subsequently used to assess the free- edge stresses and to predict the specimen’s failure load. It consists of comparing, in the close

  2. 3. Damage onset and crack pattern prediction 3.1. Preliminary linear elastic FE analyses 3D FE analyses are first performed for each load case by using two distinct steps. The first aims to model the cure phase (  T = -160 °C) and the second focuses on subsequent mechanical stresses generated Fig. 2: Pull-off tension: For some test cases, cracks when applying the average failure load measured initiated in the curved region of the 90 4 block, then experimentally (see table 1) in addition to the propagated along the 90 4 /0 7 and 0 3 /90 4 interfaces; for residual stresses. Fig 6 gives an overview of the FE other test cases, cracks initiated at the deltoid/0 3 mesh employed. Globally, one quadratic element is interface then propagated through the deltoid down introduced per 0.127 mm thick ply. A higher in to the platform region [2]. plane density of elements is introduced at the free- edges in order to guarantee a satisfactory capture of the stress gradients. Across the width, 10 elements 0.2 mm wide are used at the free-edge region then 12 elements with sizes starting from 0.233 to 1.4 crack mm at the vertical middle plane of symmetry are used. The boundary conditions, see fig. 1, are modified according the load case. For the pull-off tension case, only a quarter-geometry is used as discussed in [2]. Symmetry boundary conditions are Fig. 3: Bending at β = 0°: Crack initiating at the therefore employed where necessary. The support (roller in fig. 2) is modelled by preventing all the same location as in fig 2 but further up, then nodes on a line across the top surface of the flange propagating along the 90 4 /0 7 interface. from moving vertically. The top of the web is loaded with a uniform tensile stress distribution consistent with the average failure load N . Regarding the out- crack of-plane bending cases, the ends of the platform are clamped to model the presence of the “half - moon” supports firmly screwed together; see figs. 3-5. The top end surface of the web, being at 60 mm from the underside of the flange, is subjected to a uniform shear stress consistent with the applied lateral failure Fig. 4: Bending at β = 45°: Similar mechanism as in load F . fig 3 but with a crack initiating slightly further down in the fillet. Picture taken from this side crack crack crack Fig. 5: Bending at β = 90°: Cracks initiating in the left and right 90 4 blocks just above the lower deltoid Fig. 6: Isometric view of the FE mesh tips. Next, crack occurring at the platform/deltoid used (mesh B). interface.

  3. Careful post-processing analysis of all the FE results employed [3]. By selecting, for each load case, the shows that several stress tensor components are very most loaded node within the FE mesh and relevant high, particularly those within the 1-2-plane of both interlaminar crack paths, it is possible to assess the of the 90 4 blocks and the deltoid region shown in fig. criticality of the HSCs. Fig. 8 shows an example of 7. Because of the complexity in interpreting the application to the 0º bending case, i.e. the graph results, it is chosen to plot the maximum principal plotting the stress distribution (FE curve) across the stress component defined in the plane perpendicular width from the free-edge of the 90 4 block. This to the fibre direction. This shows that both the curve is compared to the material transverse tensile strength line,  Max = 111 MPa, and the critical curve, deltoid region and the 90 4 blocks are the most  c , giving the theoretical stress field ahead of a crack sensitive regions irrespective of the load case. Indeed, high free-edge HSCs are observed at those on the point of propagating. locations, see example in fig. 7. Those values are found to be far above the 111 MPa material 200 transverse tensile strength value [4]. Mode-I critical curve 180 Strength 160 FE curve (Mesh B) Bending direction 140 Transverse Stress [MPa] FE curve (Mesh C) Max. principal 120 stress 100 80 60 40 HSC 20 0 2 90 4 block 90 4 block 2 90 4 block 90 4 block 0 0.2 0.4 0.6 0.8 1 1 1 Distance [mm] Deltoid Deltoid Fig. 8: Example of application of the HSC method to Fig. 7: Example of HSC phenomenon at the free- the 90 4 block for the 0º bending case at the edge of the T-piece specimen for the bending case at experimental failure load F = 385 N. β = 0 º. For simplicity, only the 90 4 blocks and deltoid region are shown. In this example, two FE curves are plotted in order to assess the influence of the mesh refinement. Mesh A further investigation into the principal direction C is a sub-model in the region of HSC similar to associated with the chosen maximum principal stress mesh B but with 4 rows of elements 0.05 mm wide component reveals that, for each of the four load at the free-edge instead of one row. Since the FE curve crosses the critical curve above  Max , therefore cases, both the location of failure initiation and the original crack propagation direction are in good failure is confirmed for the load F = 385 N used in agreement with the experimental observations the FE model. Similar assessments have been also summarised in section 2. However, because the made with the HSC method for the pull-off tension HSCs are highly localised at the free-edge, it is not as well as for the bending cases at 45º and 90º. They possible to conclude if they will lead to failure. have all confirmed failure because all the FE curves Their distributions have to be compared with those crossed the critical curve above the material strength induced by the presence of abstracted cracks on the line. point of propagating from the same locations as per the previously presented HSC method [3]. 3.3. Predictive investigation The capability of the HSC method to assess failure is 3.2. Post-processing of the FE results with the now extended to predicting failure load rather than HSC method just an assessment of the criticality of HSCs at given To be able to conclude about the criticality of the loads. When increasing the applied load, failure is high-localised free-edge stresses, the HSC method is expected to occur if the FE stress distribution, the

Download Presentation
Download Policy: The content available on the website is offered to you 'AS IS' for your personal information and use only. It cannot be commercialized, licensed, or distributed on other websites without prior consent from the author. To download a presentation, simply click this link. If you encounter any difficulties during the download process, it's possible that the publisher has removed the file from their server.

Recommend


More recommend