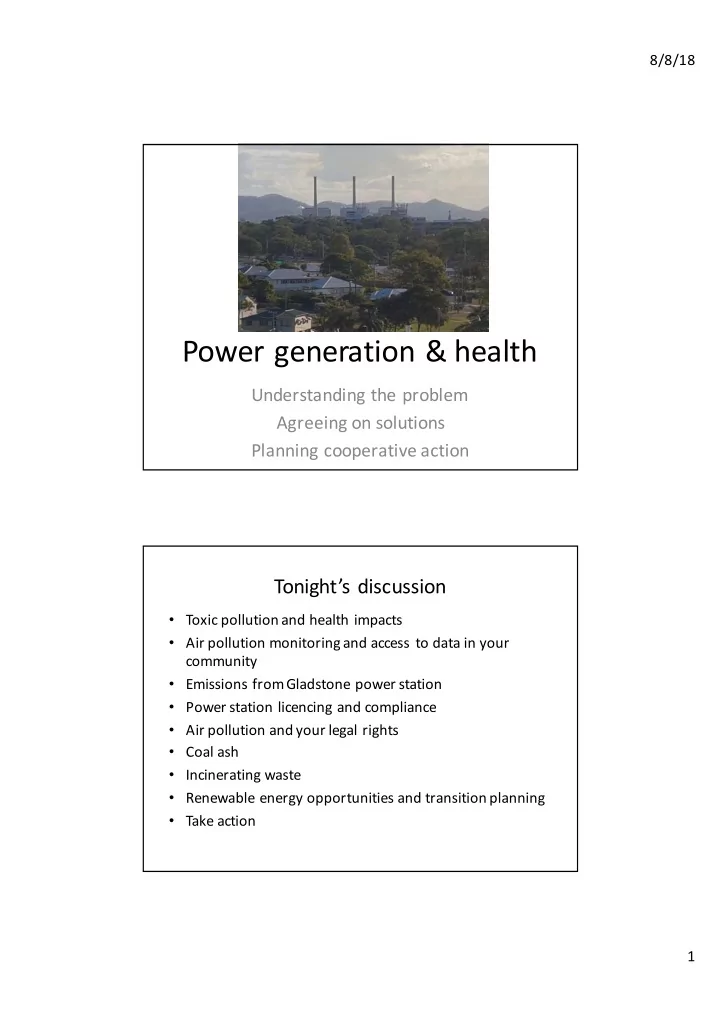
SLIDE 3 8/8/18 3
2014-15 2015-16 2016-17 Ammonia (total) 866 839 799 Arsenic & compounds 16 9 10 Beryllium & compounds 2 1 1 Boron & compounds 10,201 74,304 81,305 Cadmium & compounds 6 4 3 Carbon monoxide 781,130 754,400 718,110 Chlorine & compounds 8 20 15 Chromium (III) compounds 107 74 82 Chromium (VI) compounds 3 2 2 Cobalt & compounds 2 1 1 Copper & compounds 40 21 22 Cumene (1-methylethylbenzene) 11 11 11 Fluoride compounds 232,014 225,011 214,017 Hydrochloric acid 637,000 617,000 588,000 Lead & compounds 28 32 30 Manganese & compounds 603 455 274 Mercury & compounds 85 72 58 Nickel & compounds 113 77 86 Oxides of Nitrogen 27,908,780 30,001,040 28,800,845 Particulate Matter 10.0 um 234,100 146,800 150,200 Particulate Matter 2.5 um 88,033 49,664 48,452 Sulfur dioxide 21,500,010 22,800,004 24,400,003 Sulfuric acid 227,000 240,000 257,000 T
- tal Volatile Organic Compounds
93,940 90,329 85,990 Xylenes (individual or mixed isomers) 60 59 56 Zinc and compounds 128 88 87 T
51,714,286 55,000,316 55,345,458
Fine particle pollution (PM2.5) by source (NPI 2016-17)
Boyne Smelters Ltd, 360,000 , 55% Rio Tinto Aluminium Yarwun, 65,198 , 10% Queensland Alumina Ltd, 54,080 , 8% Gladstone Power Station, 48,452, 8% Curtis Island LNG Plant, 47,348 , 7% Gladstone Ports Corporation - (water transport), 44,520 , 7% Curtis Island GLNG Plant, 30,489 , 5%