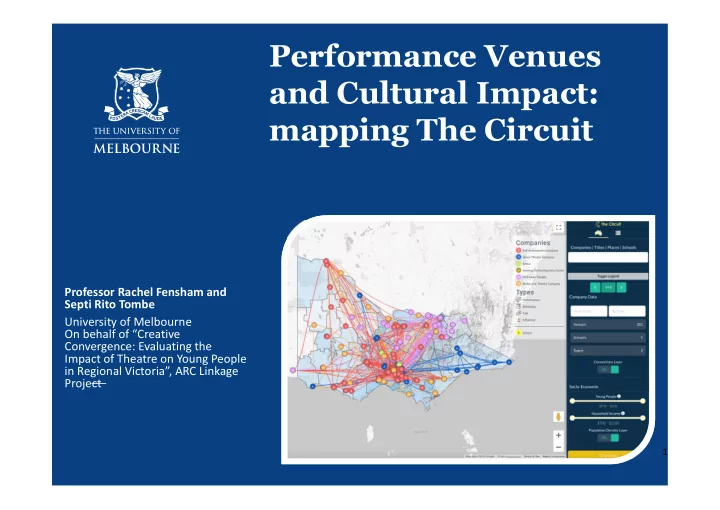
SLIDE 4 The tool was created on HTML/JS/CSS stack which is usually used for the front-end (user interface) side of a web application. In modern web browsers, this storage is called "Local Storage”, and it stores all data fetched from AusStage, ABS, and AURIN. For the map, we used Google Map APIs (Application Programming Interface), to show the map layer and standard map functions such as zoom and pan.
- On top of that layer, we usdc D3.js, a library
for JS to create the nodes, lines, population density layer. This library eases makes "svg" (a picture format) representation of the stored data based on our instructions.
4
We also used Datatables, a library which consists of JS/CSS that makes it easier to show the data in table format. All standard table functions, such as sort, filter, and paging are handled by the library, however, to match our need we introduced many modifications, for instance to our search fields.
What software was applied or developed for data integration?